Overview:
The ADA A1C chart is a vital tool for effective diabetes management, helping patients monitor their blood sugar levels and understand their health status through A1C readings. The article emphasizes that regular tracking of A1C values can lead to informed discussions with healthcare providers and facilitate necessary adjustments in treatment plans, ultimately reducing the risk of diabetes-related complications.
Introduction
In the realm of diabetes management, understanding the A1C test is paramount for both patients and healthcare providers. This essential test measures the percentage of glycated hemoglobin in the blood, serving as a key indicator of long-term blood sugar control.
With clear thresholds indicating normal levels, prediabetes, and diabetes, the A1C test not only aids in diagnosis but also plays a critical role in shaping effective treatment strategies. As the prevalence of diabetes continues to rise, the significance of regular A1C monitoring becomes increasingly evident, allowing for timely adjustments in management and ultimately improving patient outcomes.
This article delves into the intricacies of the A1C test, offering insights into its interpretation, tracking methods, and practical strategies for achieving optimal levels, all while emphasizing the importance of community support and education in navigating the complexities of diabetes care.
Understanding the A1C Test: A Cornerstone of Diabetes Management
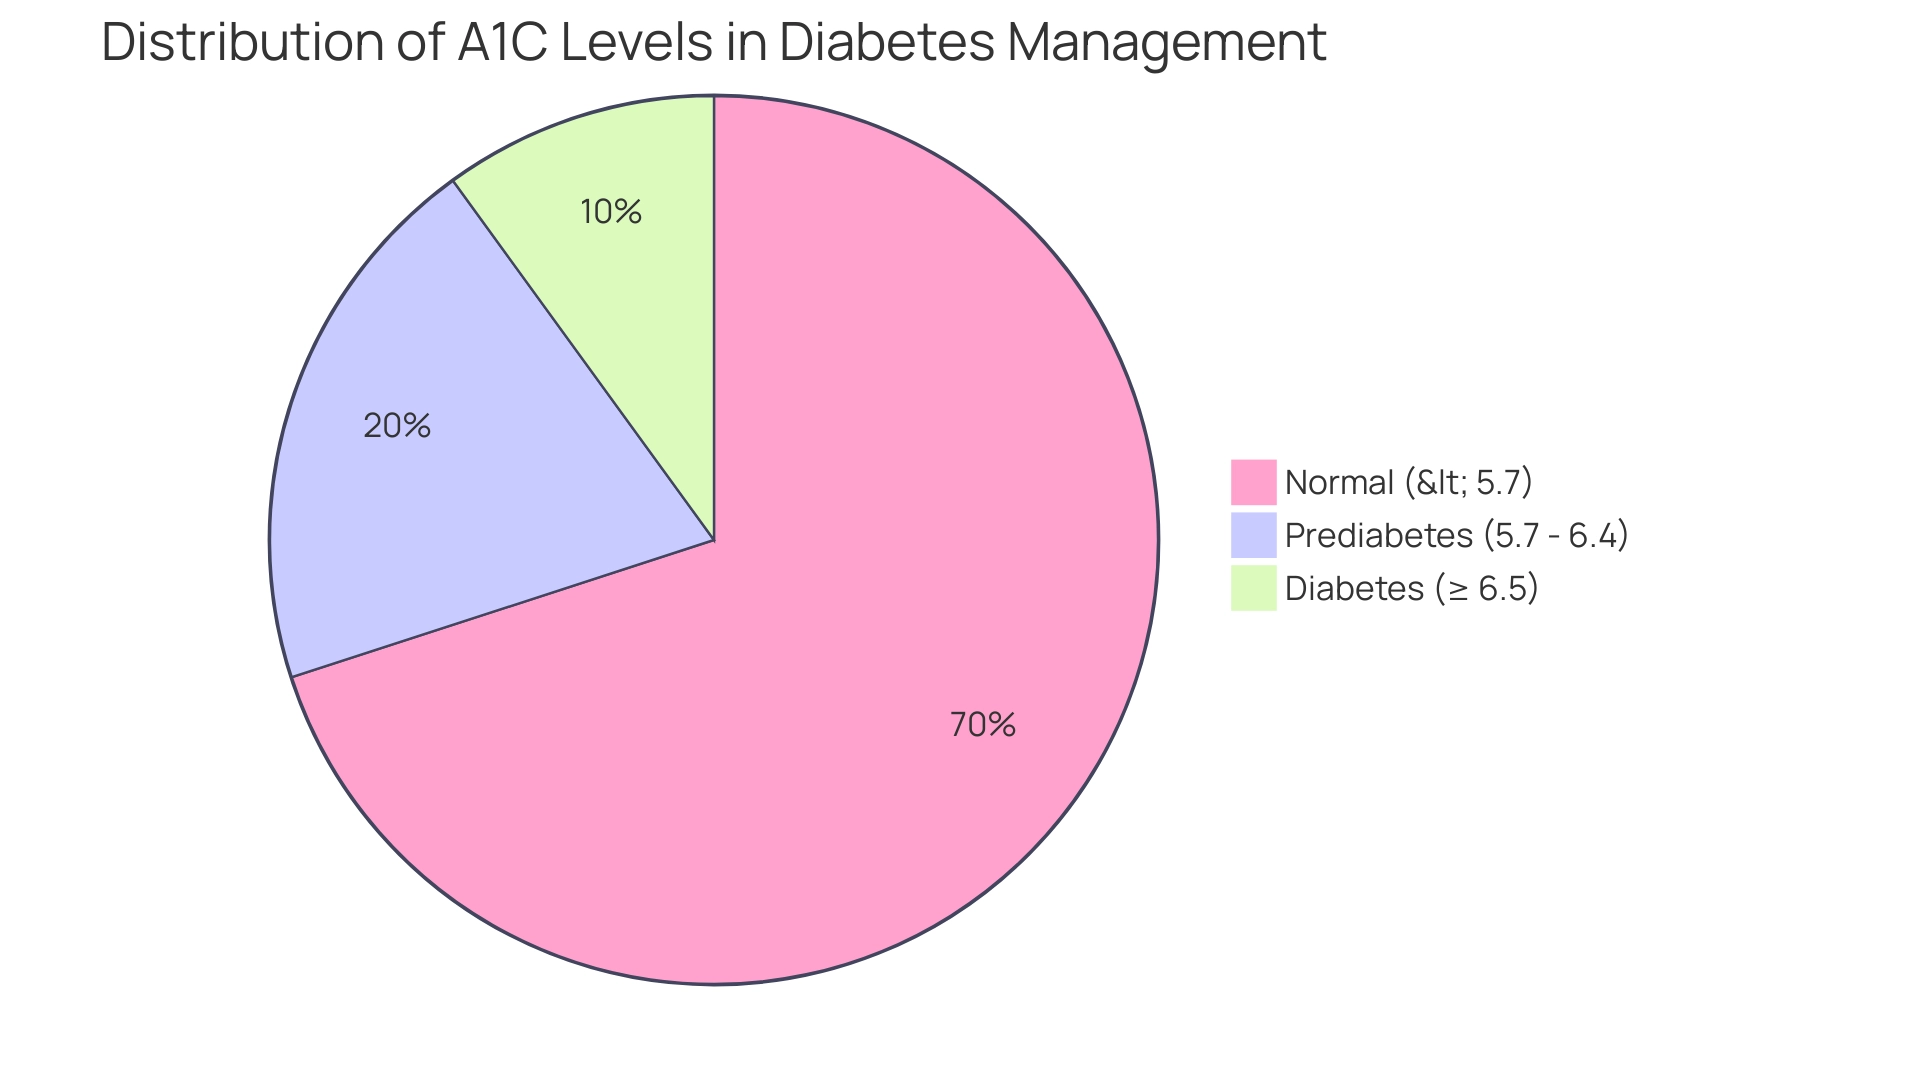
The A1C test is instrumental in managing blood sugar levels and is typically displayed on an ADA A1C chart, quantifying the percentage of hemoglobin in the blood that has bonded with glucose, known as glycated hemoglobin. According to the ADA A1C chart:
- A typical A1C measurement is usually regarded as being under 5.7%.
- Readings between 5.7% and 6.4% suggest prediabetes.
- An A1C of 6.5% or above verifies a diagnosis of the condition.
Regular monitoring of the ADA A1C chart is crucial as it reveals patterns in blood sugar control, enabling healthcare providers to make informed adjustments to the treatment regimen.
Recent studies indicate that some individuals with the condition can achieve A1C levels below 6.5% through a combination of lifestyle modifications and medication. This emphasizes the test's significance as a benchmark for assessing the effectiveness of administrative strategies.
T2DSolutions is launching as a comprehensive resource hub dedicated to Type 2 and Type 3 health education and community support, aimed at newly diagnosed patients seeking guidance. The site will provide various resources, including:
- Educational articles on A1C control
- Community forums for peer support
- Expert consultations to assist patients in navigating their health journey
Furthermore, Unwin et al. highlighted the differences in prevalence and phenotype of the condition and prediabetes when comparing fasting glucose to HbA1c in a Caribbean population, emphasizing the need for tailored approaches in handling this health issue.
Additionally, Roopa Naik has disclosed that she has no relevant financial relationships with ineligible companies, reinforcing the credibility of the information provided. The economic burden of this condition is significant, with an estimated total cost of $413 billion in the United States for diagnosed cases in 2022. This statistic highlights the critical need for effective diabetes management practices, which include the ADA A1C chart as a foundational component.
Utilizing the A1C Chart for Effective Diabetes Tracking and Management
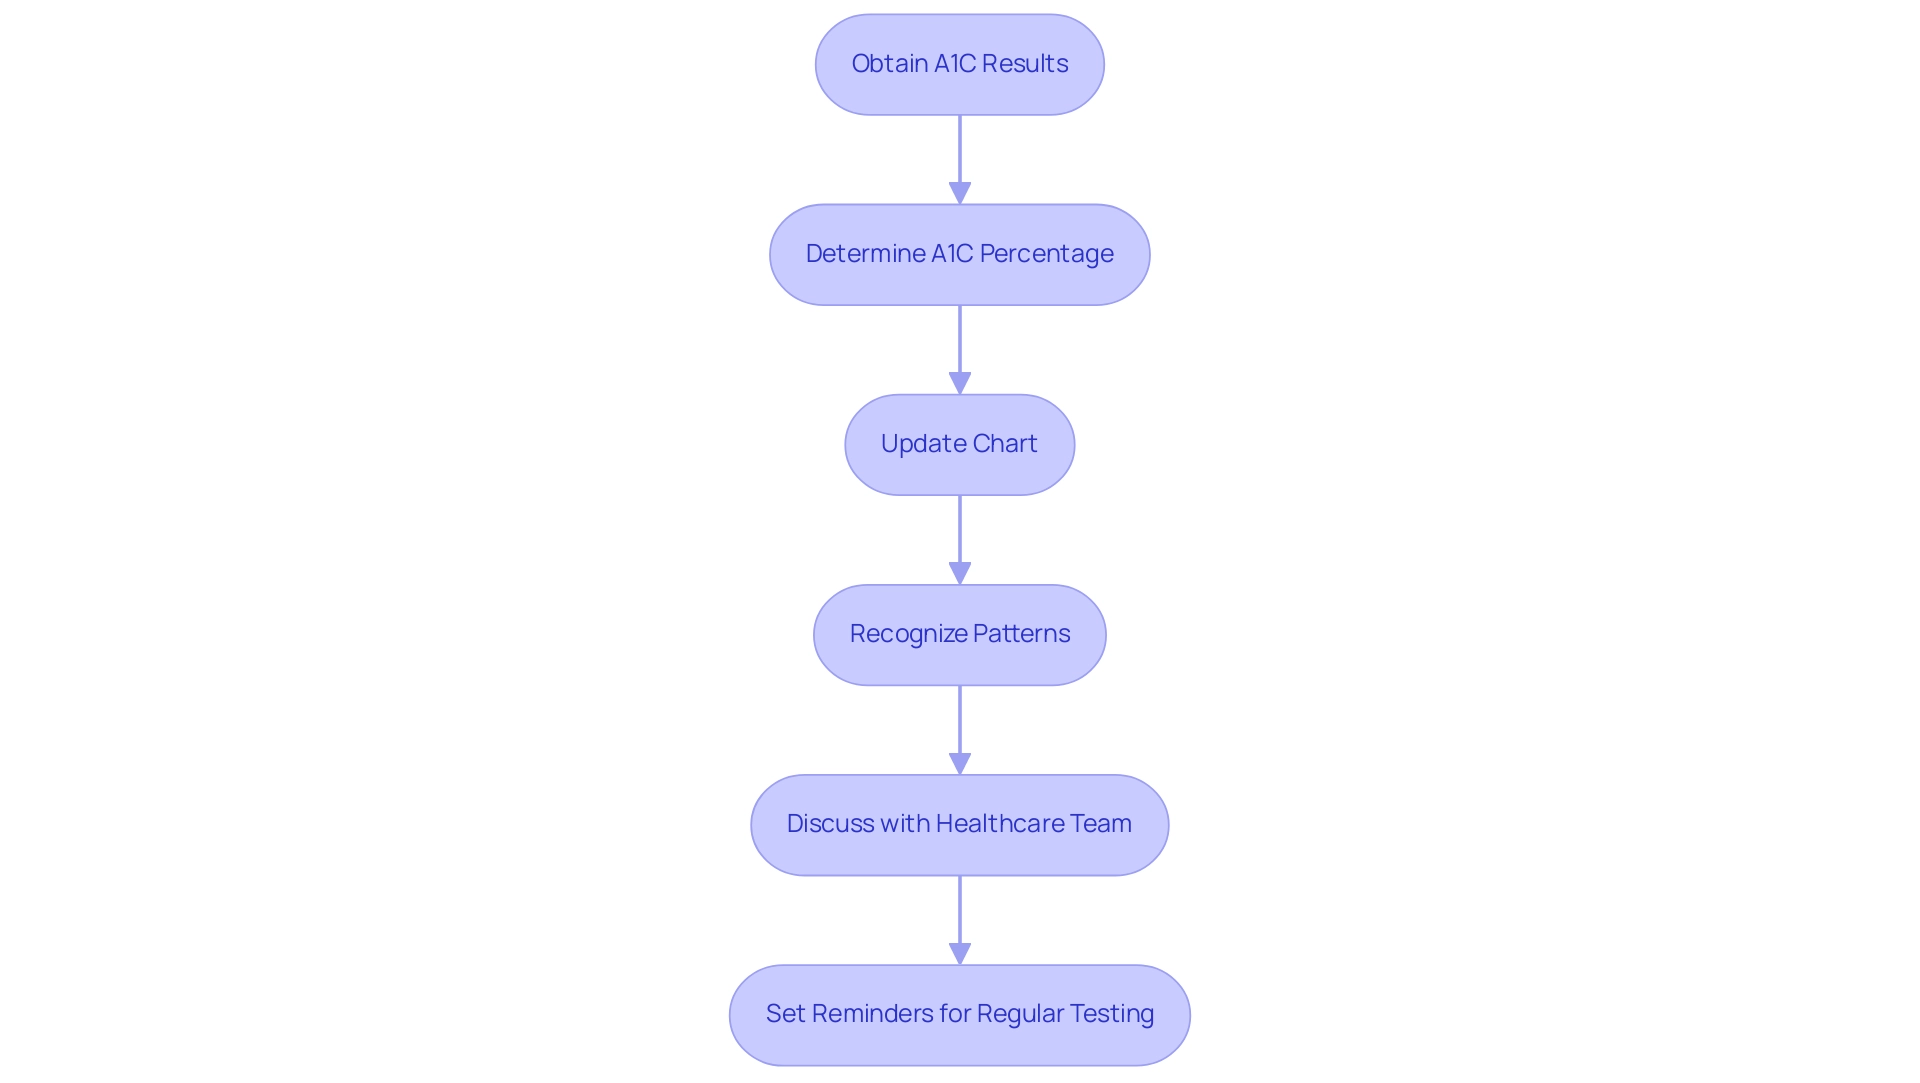
To effectively utilize the A1C chart, newly diagnosed patients should start by obtaining their most recent A1C results from their healthcare provider. Determine your A1C percentage on the chart, which usually relates to average blood glucose readings. Regularly updating the chart with your results is crucial, as it allows for the visualization of trends over time.
This practice not only aids in recognizing patterns but also facilitates informed discussions with your healthcare team regarding potential adjustments to your treatment plan. To ensure consistent tracking, it is advisable to set reminders for regular testing. According to a systematic review, monitoring A1C values is essential, given that the annual incidence of A1C ≥7.0 is 22.7% with a relative risk of 201.4, underscoring the significant impact on overall health outcomes.
As Xuanping Zhang pointed out, 'This is a significant public health priority since a structured lifestyle program or the medication metformin can decrease the occurrence of diabetes-related conditions by at least 50% and 30%, respectively.' By effectively controlling A1C levels, patients can utilize these insights for improved condition oversight. Td Solutions is here to provide comprehensive resources and community support, including educational articles, tracking tools, and community forums, emphasizing the importance of diligent A1C monitoring and management strategies.
Additionally, the high admission rate for hyperglycemic crisis cases—where 84.4% of emergency department visits resulted in hospitalization—further emphasizes the need for these proactive measures. One user shared, 'Thanks to T2DSolutions, I found the support and resources I needed to manage my condition effectively.
Interpreting A1C Results: What Your Numbers Mean for Your Health
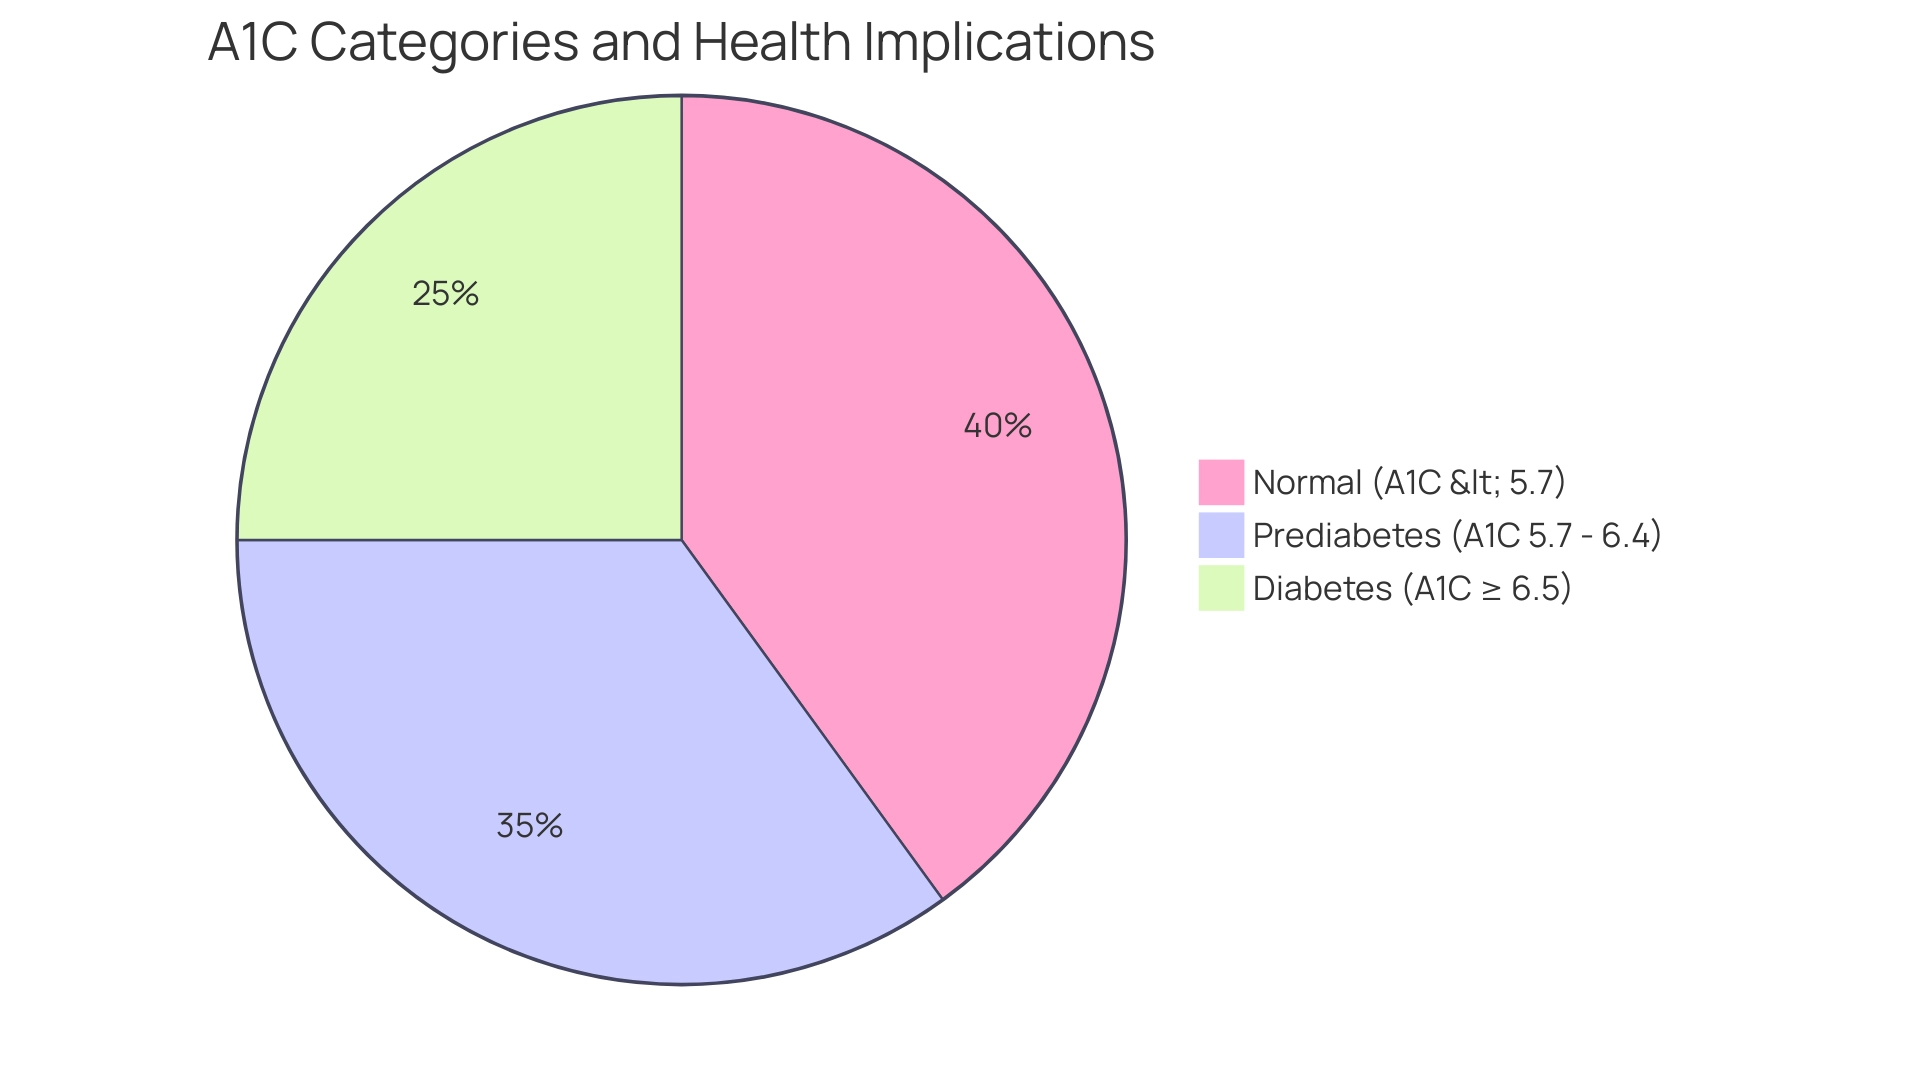
T2DSolutions is proud to introduce a comprehensive resource hub dedicated to Type 2 and Type 3 blood sugar management education and community support. Comprehending your A1C values, as illustrated in the ada a1c chart, is essential for efficient control of your condition. According to the ada a1c chart, an A1C measurement of under 5.7% is considered normal, indicating proper blood sugar control.
When an individual's A1C falls between 5.7% and 6.4% according to the ada a1c chart, this indicates a state of prediabetes. At this stage, lifestyle changes—such as enhanced nutrition and heightened physical activity—can significantly lower the risk of advancing to the condition. Conversely, an A1C level of 6.5% or higher indicated on the ada a1c chart confirms a diagnosis of this condition, which requires prompt attention to management strategies.
Recent insights from the National Center for Health Statistics reveal that between 1999 and August 2023, the age-adjusted prevalence of diagnosed blood sugar conditions has notably increased, with Cheryl D. Fryar, M.S.P.H. noting that 'the age-adjusted prevalence of total and diagnosed cases of diabetes mellitus increased during this period.' This underscores the need for effective monitoring and interventions.
Grasping the implications of these results enables patients to work together with their healthcare providers in modifying their care plans, ultimately improving their health outcomes. Regular screenings, especially for individuals with obesity, are essential, as the occurrence of undiagnosed conditions increases from 1.6% in those with a normal weight to 7.9% among those categorized as obese. Additionally, the incidence rate of diagnosed metabolic disorder among Asian, non-Hispanic adults stands at 3.8 per 1,000, highlighting the importance of tailored health assessments.
To support you in managing your diabetes, T2D Solutions will provide a variety of educational resources and community support initiatives. We urge you to subscribe for updates to remain informed about new content and resources that can help you in comprehending your A1C values and enhancing your overall health upkeep. This trend highlights the essential link between the ada a1c chart, A1C readings, regular health assessments, and proactive health management.
Strategies for Achieving Your Target A1C: Practical Tips for Success
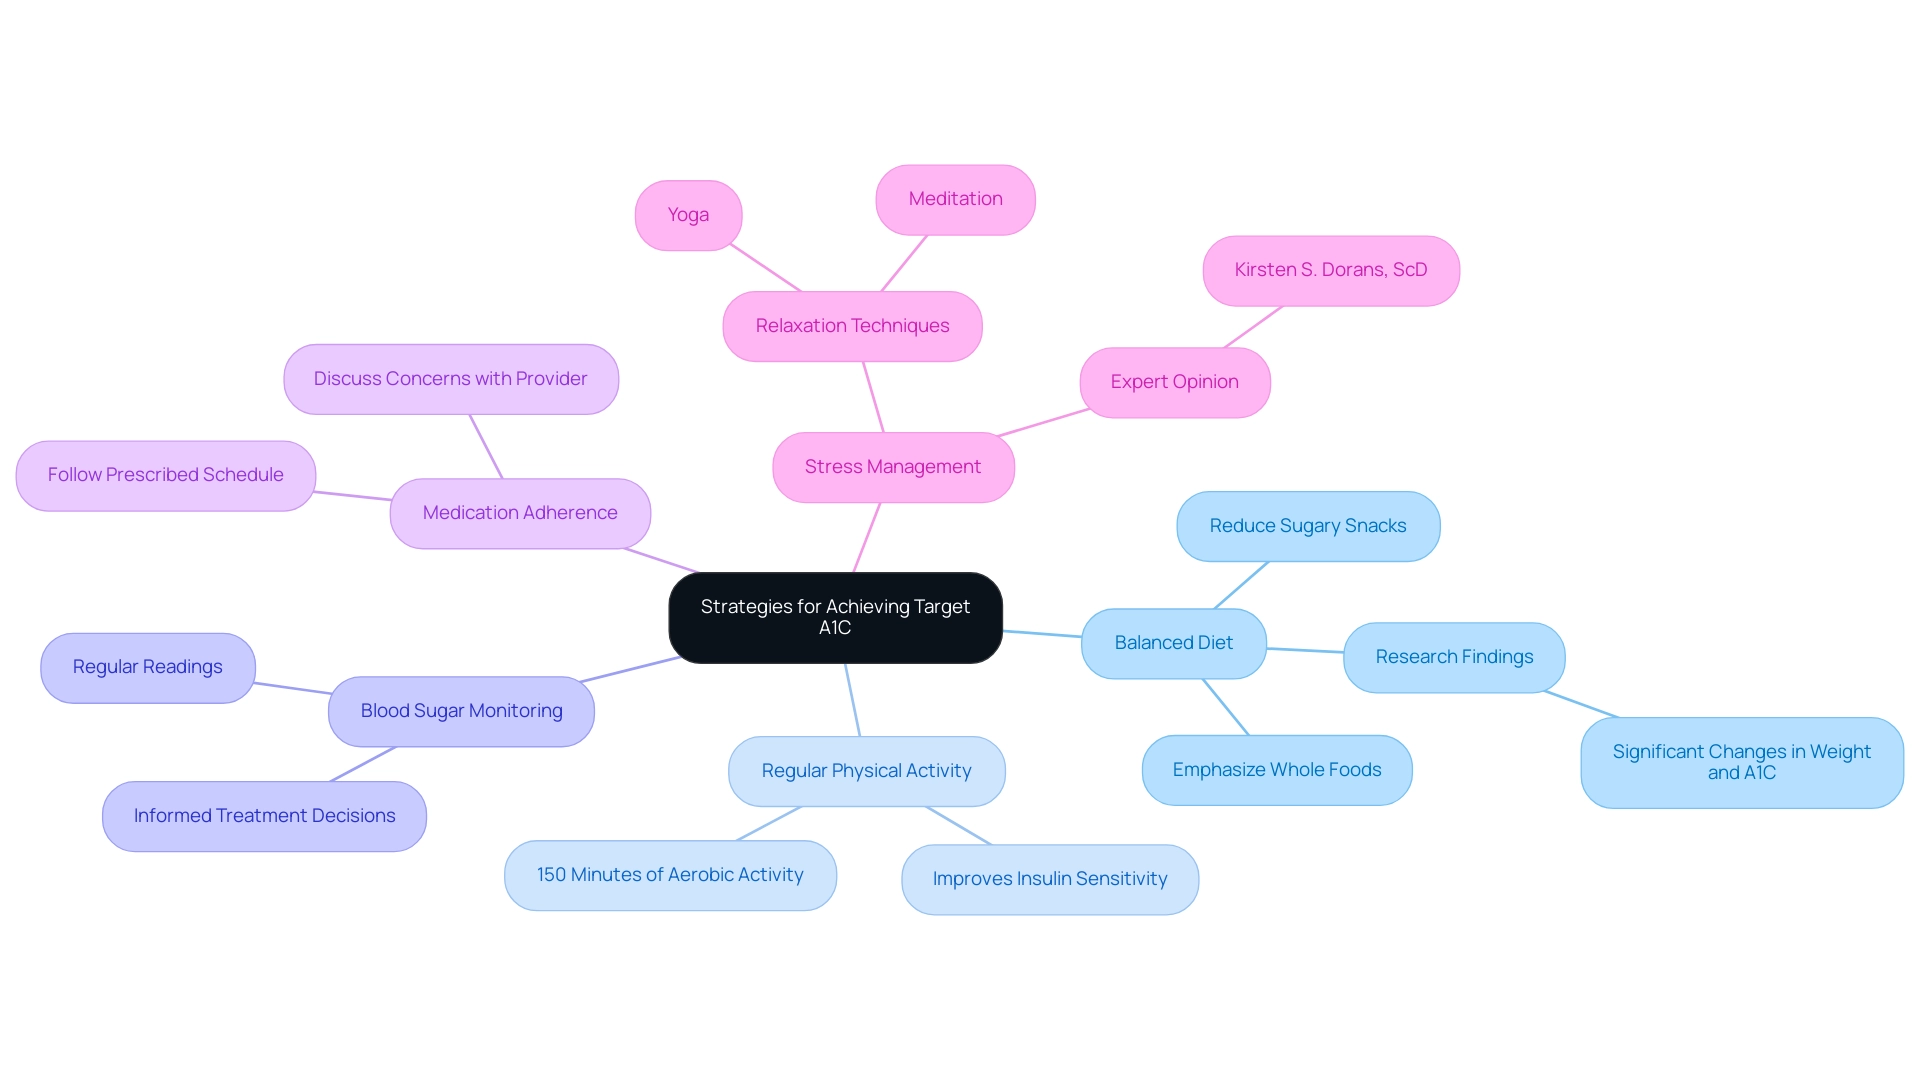
atd Solutions, our goal is to be your comprehensive resource for managing Type 2 and Type 3 diabetes, including effective strategies for reaching your target A1C. To help you achieve this, consider implementing the following strategies:
-
Maintain a Balanced Diet: Emphasize whole foods such as fruits, vegetables, whole grains, and lean proteins.
Cutting down on sugary snacks and refined carbohydrates can significantly affect A1C values. Research indicates that dietary changes can lead to measurable improvements in glycemic control. A recent statistical analysis demonstrated that participants who adhered to a balanced diet saw significant changes in weight and A1C values over 12 months. -
Regular Physical Activity: Aim for a minimum of 150 minutes of moderate aerobic activity each week.
Participating in such physical activity can improve insulin sensitivity and help reduce blood sugar amounts. Expert opinions suggest that consistent exercise is vital for diabetes management. -
Monitor Blood Sugar Readings: Regular monitoring of blood glucose readings helps you understand how your diet and activity influence your A1C.
This practice allows for more informed decisions regarding your treatment plan. -
Adhere to Medication Regimens: Following your prescribed medication schedule is crucial for maintaining optimal blood sugar control.
Should you have any concerns or experience side effects, it's imperative to discuss these with your healthcare provider. -
Stress Management: Implement relaxation techniques such as yoga or meditation to mitigate stress, which can adversely affect blood sugar levels.
By handling stress efficiently, you can improve your overall health control strategy. According to Kirsten S. Dorans, ScD, from Tulane University, these approaches are essential for achieving better health outcomes in individuals with this condition.
It's important to note that the excess medical costs associated with the condition have risen from $10,179 in 2012 to $12,022 in 2022, highlighting the financial implications of effective management. Furthermore, with an estimated 29.4 million adults diagnosed with diabetes and 8.7 million undiagnosed, managing A1C values is more crucial than ever. At T 2 Solutions, we are committed to providing you with the latest resources and support to help you implement these strategies effectively.
The Health Benefits of Lowering Your A1C: Risk Reduction and Improvements
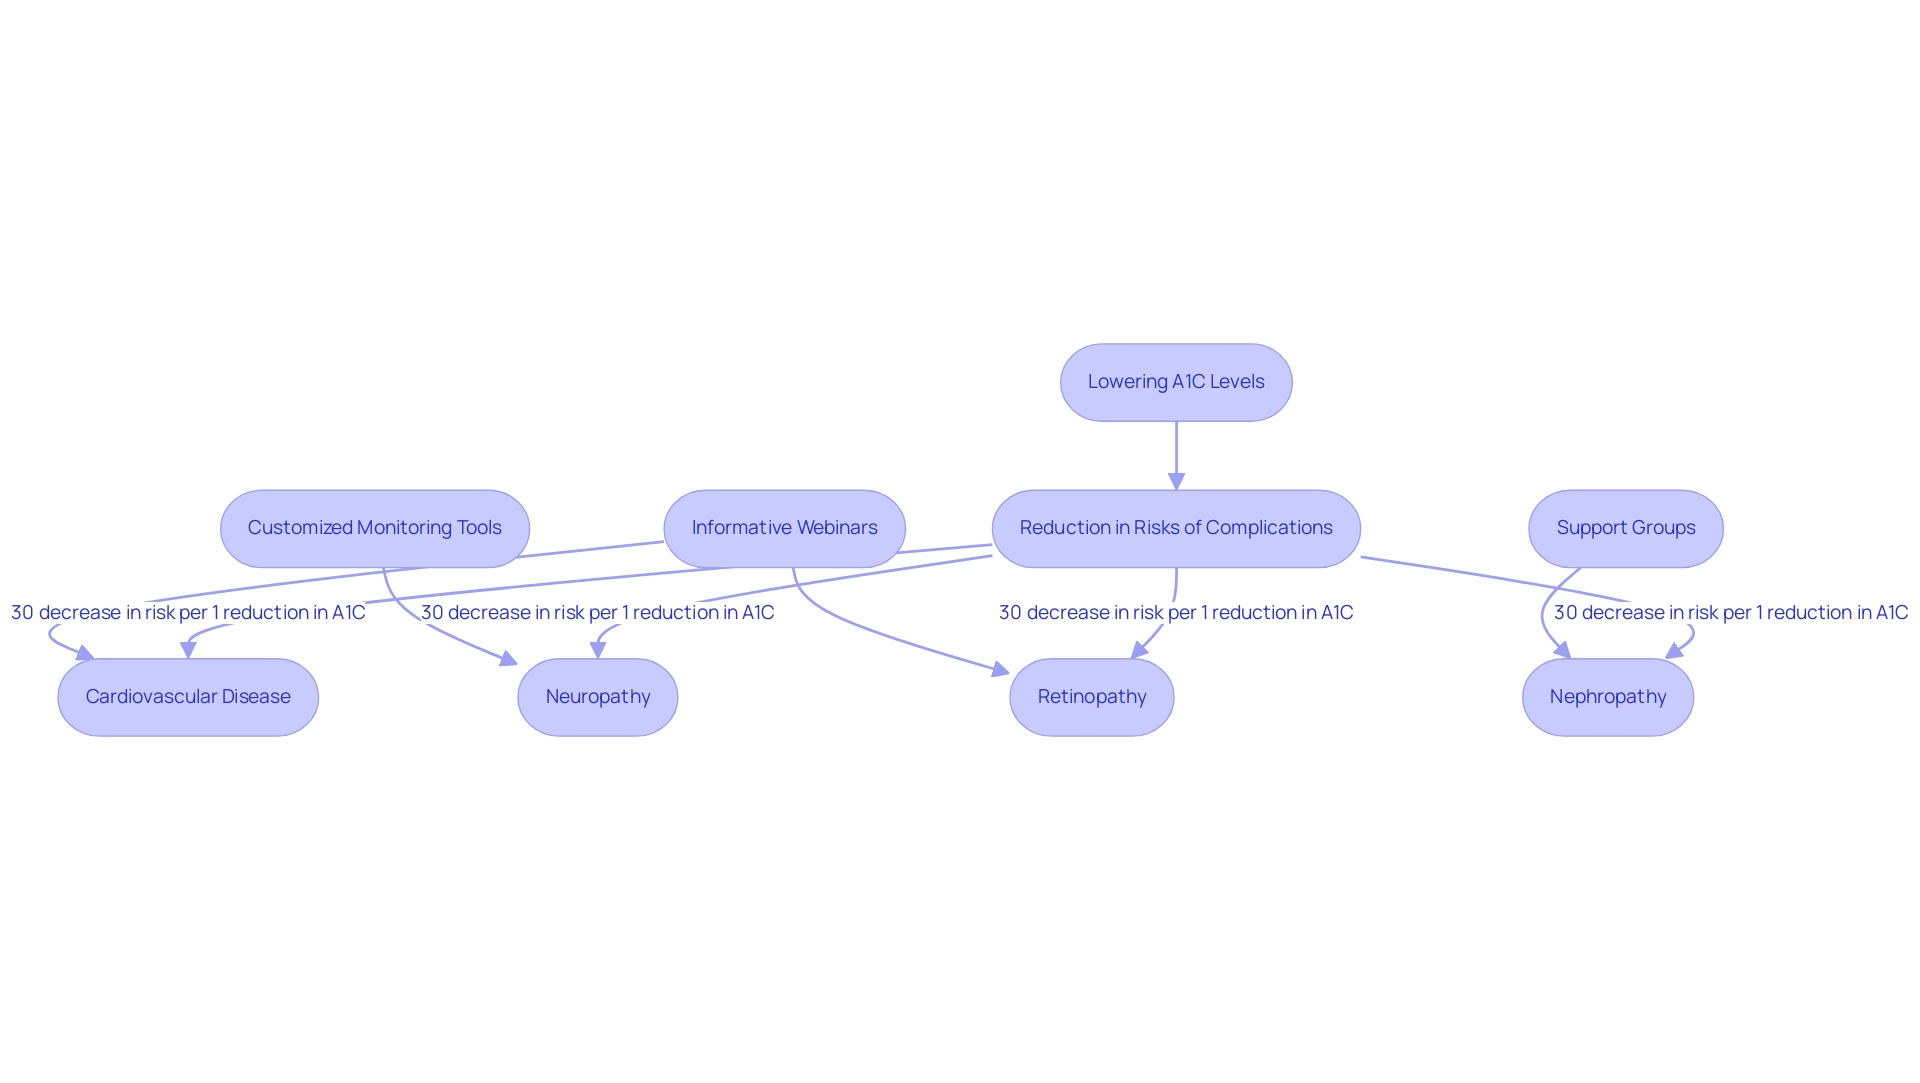
The ada a1c chart indicates that reducing your A1C levels can substantially lower the risk of diabetes-related complications, such as:
- Cardiovascular disease
- Neuropathy
- Nephropathy
- Retinopathy
Research has shown that for each 1% reduction in A1C, there is an approximate 30% decrease in the risk of developing these complications. This statistic highlights the critical connection between the ada a1c chart and health outcomes.
Td Solutions is committed to enhancing health oversight through education and community assistance, offering resources like:
- Informative webinars
- Customized A1C monitoring tools
- Access to support groups
These initiatives emphasize the significance of tracking A1C values and utilizing metrics like the OGTT, as well as the ada a1c chart, for more accurate predictions of progression to diabetes in individuals with glucose intolerance. Notably, from 2017 to 2020, prediabetes awareness among Hispanic adults was only 20.9%, underscoring the need for targeted education and intervention in this demographic.
With a mean total sample size of 44,203 participants and a mean follow-up of 5.6 years, the findings related to the ada a1c chart management are robust. Recent studies further corroborate that improved A1C readings not only reduce health risks but also enhance overall well-being, leading to increased energy and a better quality of life. By prioritizing the achievement and maintenance of target A1C levels as indicated by the ada a1c chart, individuals can protect their health and empower themselves to pursue a more fulfilling lifestyle.
Moreover, findings from a systematic review focused on A1C and future diabetes incidence suggest that strategic interventions aimed at A1C management, supported by resources from T2DSolutions, could significantly influence public health outcomes, aiding in the prevention or delay of type 2 diabetes by establishing effective diagnostic cut points for prediabetes, particularly as outlined in the ada a1c chart.
Conclusion
Understanding and managing A1C levels is crucial for individuals navigating diabetes. The A1C test serves as a vital tool, offering insights into long-term blood sugar control and enabling healthcare providers to tailor treatment strategies accordingly. Regular monitoring not only aids in recognizing trends but also empowers patients to engage actively in their management plans. With clear thresholds indicating normal levels, prediabetes, and diabetes, patients can make informed decisions about lifestyle modifications and medication adherence to achieve optimal health outcomes.
The strategies outlined for achieving target A1C levels emphasize the importance of:
- A balanced diet
- Regular physical activity
- Consistent monitoring
- Effective stress management
Each of these elements plays a significant role in reducing the risk of complications associated with diabetes. Furthermore, the economic implications of diabetes underscore the necessity of effective management practices, as the costs associated with inadequate control can be substantial.
Ultimately, prioritizing A1C management not only enhances individual health but also contributes to broader public health initiatives aimed at reducing the prevalence of diabetes. By leveraging resources and community support, patients can navigate their diabetes journey with confidence, making strides toward a healthier future. The commitment to education and proactive management can lead to improved quality of life and reduced health risks, reinforcing the critical nature of A1C monitoring in diabetes care.


