Introduction
Understanding diabetes management is crucial for individuals navigating their health journey, and the A1C test stands at the forefront as a vital tool in this process. By measuring the percentage of glucose attached to hemoglobin in red blood cells, this test provides a comprehensive overview of average blood sugar levels over the past two to three months.
With clear benchmarks indicating diabetes and prediabetes, the A1C test empowers patients and healthcare providers alike to make informed decisions regarding treatment plans. As the prevalence of diabetes continues to rise, understanding the implications of A1C levels becomes increasingly important for effective management.
This article delves into the intricacies of the A1C test, its interpretation, lifestyle changes to improve results, and the significance of personalized target goals, equipping readers with the knowledge necessary for proactive diabetes care.
Understanding the A1C Test: A Key Tool in Diabetes Management
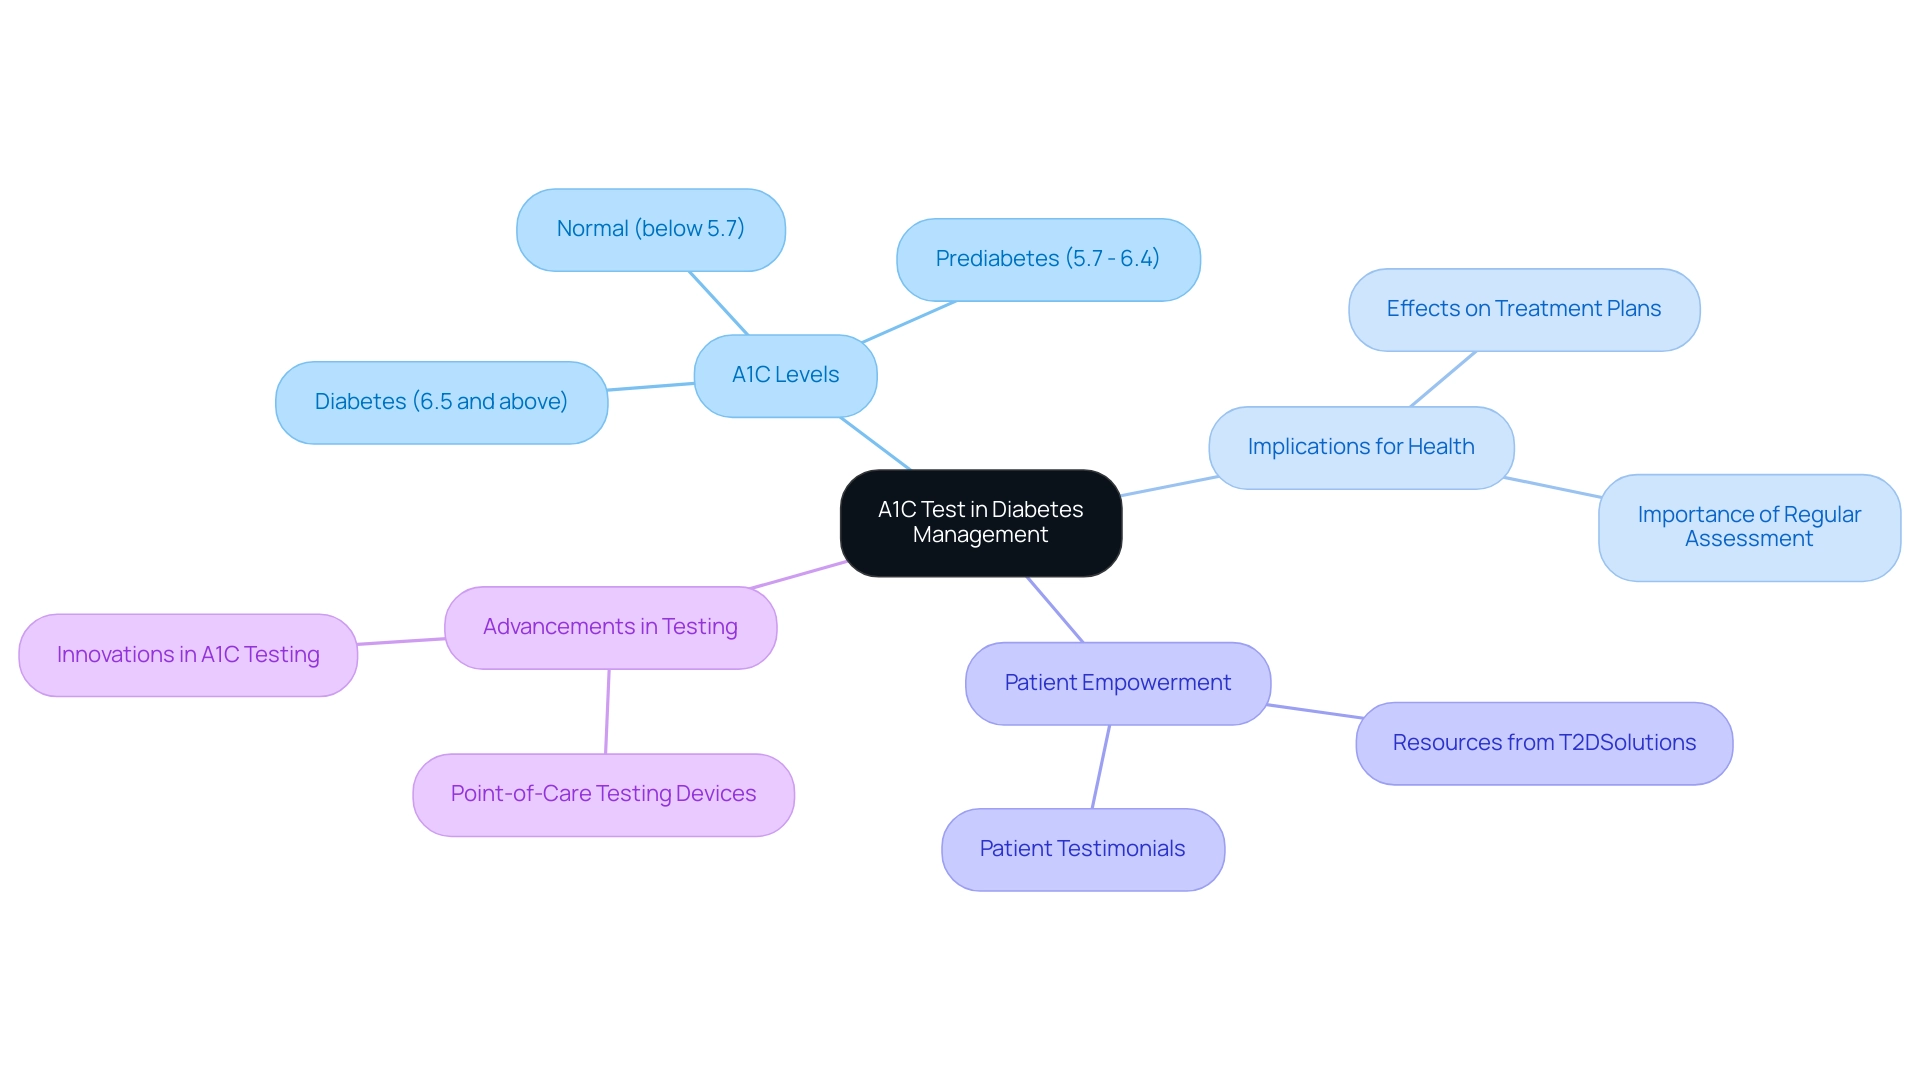
The A1C test, commonly referred to as the glycated hemoglobin test, quantifies the percentage of glucose bound to hemoglobin in red blood cells. This measurement provides a vital indication of typical blood sugar levels over the prior two to three months, which is crucial for effective management of the condition and can be referenced in the a1c to average blood sugar chart. An A1C measurement of 6.5% or above indicates a medical condition, while readings between 5.7% and 6.4% imply prediabetes, requiring additional observation and intervention.
Regular assessment of A1C levels enables healthcare providers to evaluate long-term glycemic control and reference the a1c to average blood sugar chart to make informed adjustments to treatment plans. By understanding the implications of this test, patients are empowered to actively participate in their care, gaining valuable insights into the effectiveness of their current strategies. Moreover, expert opinions highlight that glycemic targets should be individualized, as each patient's condition may vary significantly.
Recent advancements in A1C testing, such as the development of point-of-care testing devices, have shown promise in providing rapid results, allowing for timely treatment adjustments. T2DSolutions is dedicated to providing comprehensive resources and community support to newly diagnosed patients, ensuring they have the tools necessary for informed decision-making. Testimonials from patients emphasize the effectiveness of T2DSolutions' resources, with many reporting improved understanding of their condition and enhanced approaches.
Moreover, ongoing studies persist in emphasizing the crucial function of A1C testing in the context of the a1c to average blood sugar chart, guaranteeing that patients obtain personalized and efficient care. As one study concluded, 'we found that A1C level was effective and convenient for screening of blood sugar conditions.' Furthermore, a minor study named 'Correlation Between A1C and CGM Data in Children' discovered a noteworthy link between A1C and average blood glucose, highlighting the necessity for additional investigation to grasp its implications across various populations, as t2d solutions persists in promoting innovative insights in the field.
Interpreting A1C Levels: Connecting A1C to Average Blood Sugar
Welcome to T2DSolutions, your new comprehensive resource hub for Type 2 and Type 3 blood sugar management education and community support. As you embark on your diabetes management journey, understanding A1C values will be crucial. A1C values are quantified as a percentage, with each percentage point reflecting a corresponding average blood sugar amount measured in milligrams per deciliter (mg/dL) according to the a1c to average blood sugar chart.
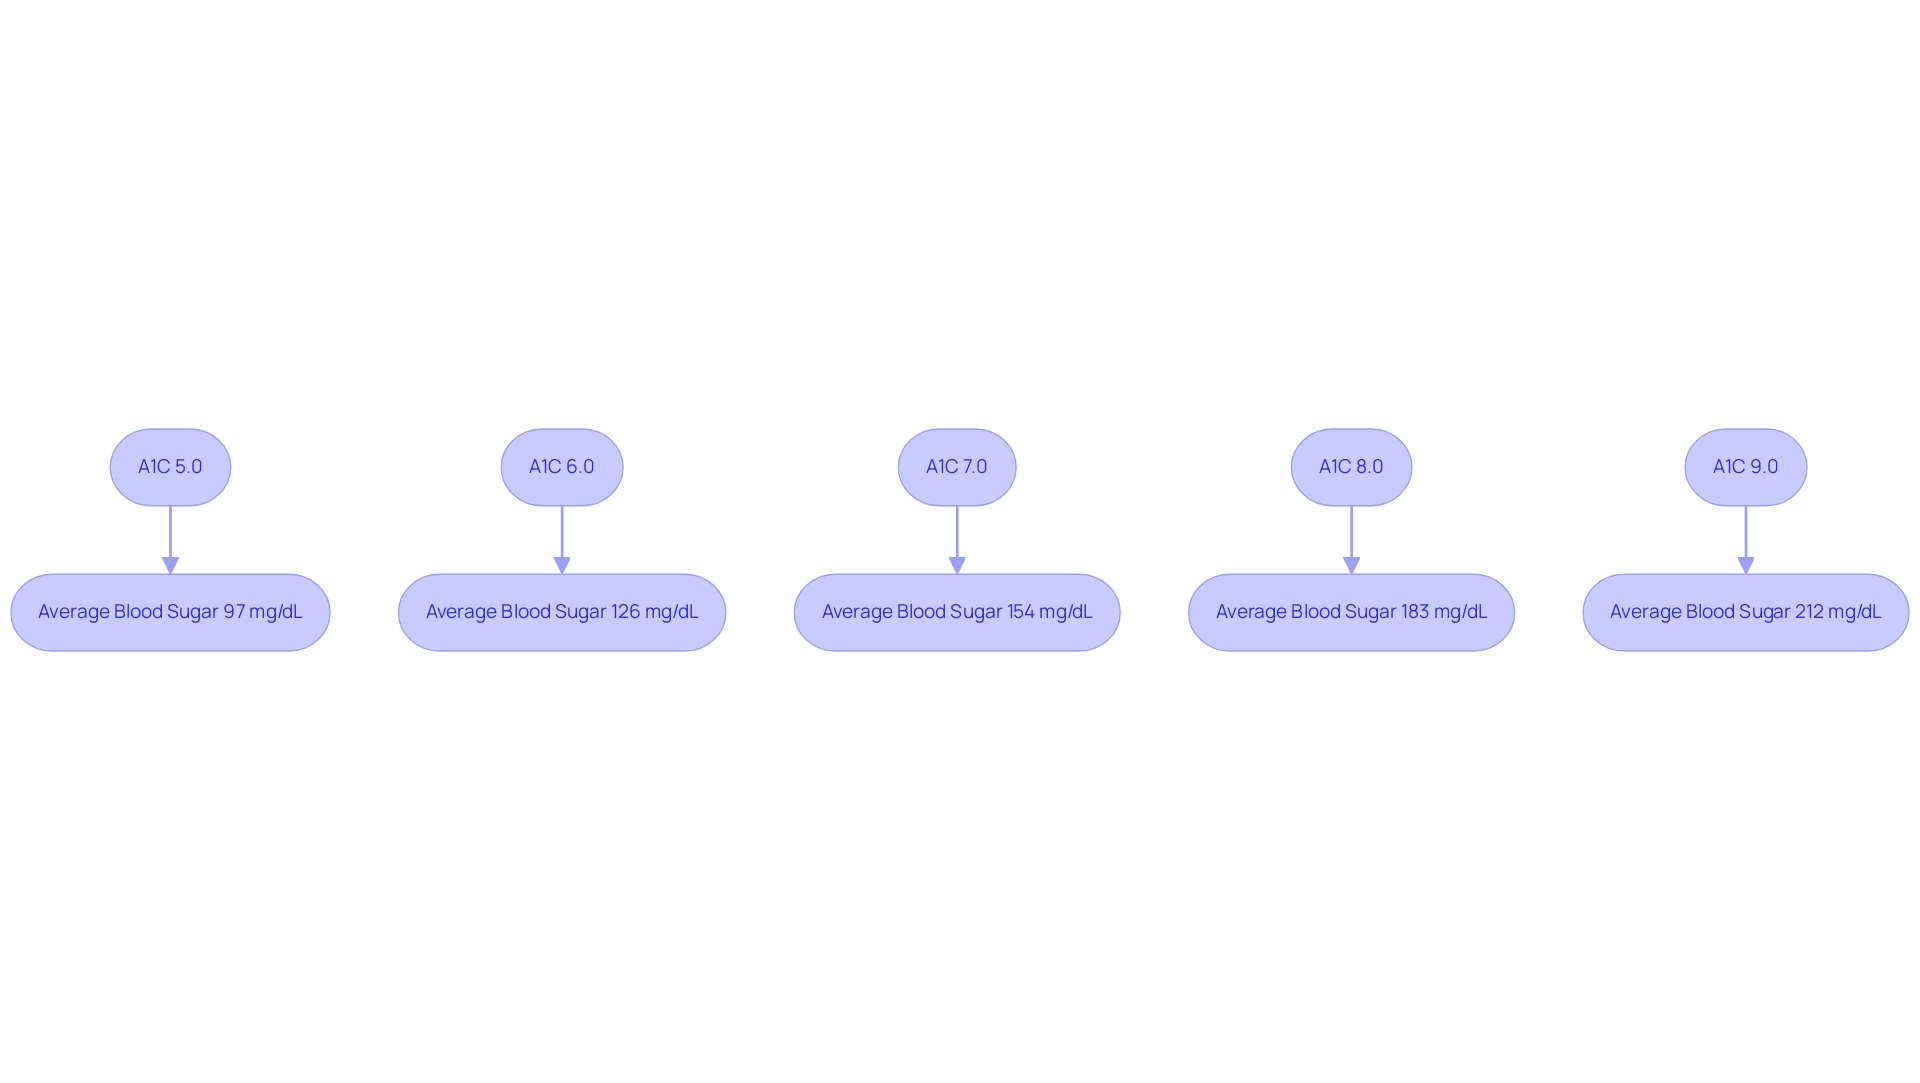
For example, an A1C value of 6.0% corresponds to approximately 126 mg/dL on the a1c to average blood sugar chart. The following chart delineates the relationship between A1C percentages and the a1c to average blood sugar chart levels:
- A1C 5.0% = Average Blood Sugar 97 mg/dL
- A1C 6.0% = Average Blood Sugar 126 mg/dL
- A1C 7.0% = Average Blood Sugar 154 mg/dL
- A1C 8.0% = Average Blood Sugar 183 mg/dL
- A1C 9.0% = Average Blood Sugar 212 mg/dL
This understanding is critical for newly diagnosed patients as it enables effective interpretation of A1C results, facilitating timely adjustments to lifestyle and treatment plans. Continuous communication with healthcare professionals concerning A1C goals is essential for effective control of the condition.
Recent studies indicate that the age-adjusted prevalence of the condition has escalated from 1999–2000 through August 2023, underscoring the importance of regular monitoring and strategic management. Notably, 93.0% of individuals had their cholesterol checked, highlighting the significance of routine health assessments in managing blood sugar levels. Furthermore, the occurrence of diagnosed health condition remains consistent among adults in both metropolitan and nonmetropolitan areas, emphasizing the need for widespread awareness and education.
Cheryl D. Fryar, M.S.P.H., notes, > The age-adjusted prevalence of total and diagnosed blood sugar issues increased between 1999–2000 and August 2021–August 2023. This trend, as discussed in the case study titled 'Trends in Diabetes Prevalence Over Time,' reinforces the necessity for individuals to stay informed about their average blood sugar and a1c to average blood sugar chart to maintain effective diabetes care. To stay updated on the latest resources and community support available through T2DSolutions, we encourage you to subscribe to our newsletter.
Lifestyle Changes to Improve A1C Levels
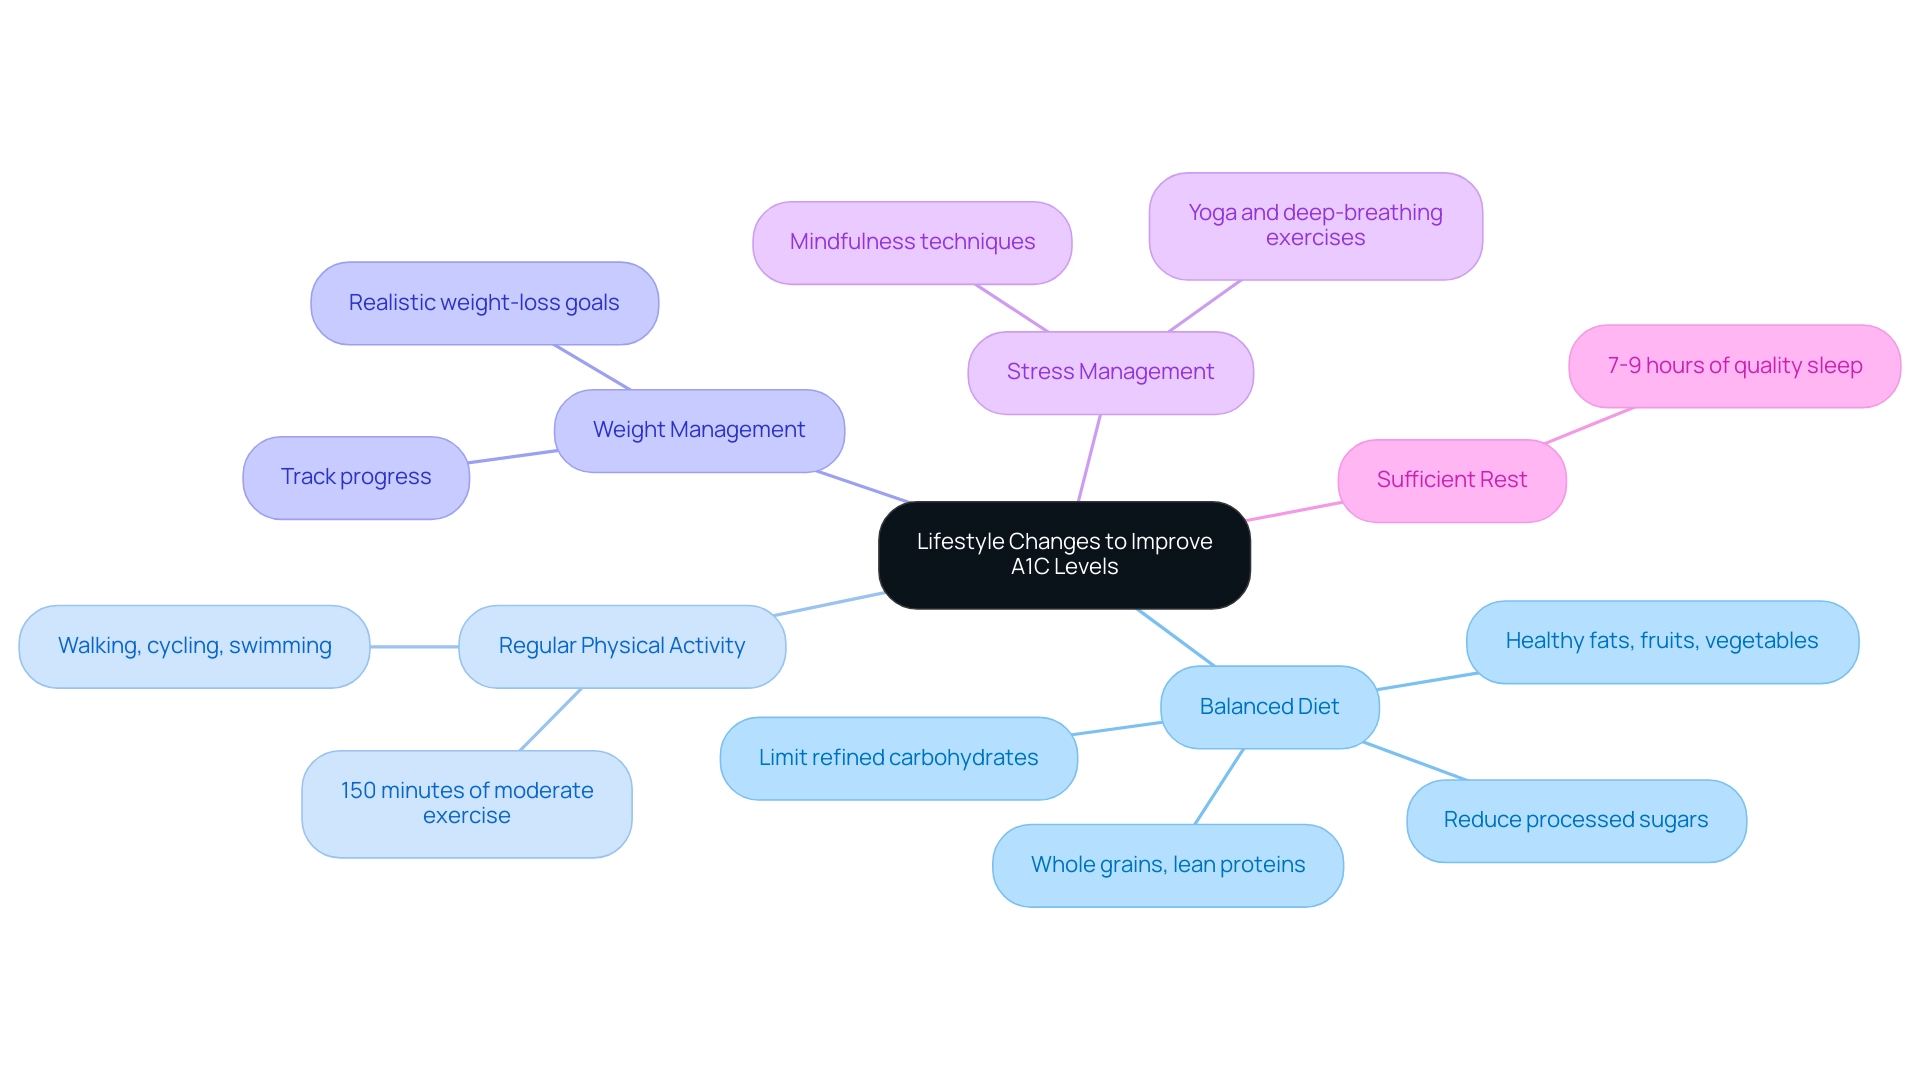
To effectively reduce A1C values, individuals should consider implementing the following lifestyle changes:
-
Balanced Diet: Prioritize a diet that includes whole grains, lean proteins, healthy fats, fruits, and vegetables. Reducing the intake of processed sugars and refined carbohydrates is crucial, as these foods can lead to significant spikes in blood glucose levels.
-
Regular Physical Activity: It is recommended to engage in at least 150 minutes of moderate exercise each week. Activities such as walking, cycling, or swimming can enhance insulin sensitivity and contribute to lower blood sugar levels.
-
Weight Management: Even a modest reduction in body weight can lead to significant improvements in A1C readings. Establishing realistic weight-loss goals and tracking progress can be highly beneficial for individuals seeking to manage their diabetes.
-
Stress Management: Incorporating stress-reduction techniques such as mindfulness, yoga, or deep-breathing exercises is essential, as stress has a direct negative impact on blood sugar control.
-
Sufficient Rest: Aim for 7-9 hours of quality sleep nightly, as insufficient rest can negatively influence insulin sensitivity and overall blood glucose control.
According to the American Diabetes Association (ADA), individuals with excess weight or obesity and other risk factors are at heightened risk for this condition, which underscores the significance of managing the A1C to average blood sugar chart. A recent pilot study on the episodic use of unblinded real-time p-CGM demonstrated that 34.1% of patients achieved an A1C <7.5% at 12 weeks, suggesting that lifestyle changes can result in significant enhancements, as illustrated in the A1C to average blood sugar chart. By systematically incorporating these lifestyle modifications, individuals can enhance their management of the condition and achieve better A1C levels, which can be tracked on the A1C to average blood sugar chart over time.
The ADA emphasizes that such changes are foundational for effective care, particularly for those navigating the challenges of a new diagnosis.
Monitoring Your A1C: When and How Often to Test
As we launch T2DSolutions, a new resource hub dedicated to Type 2 and Type 3 glucose management education and community support, we invite you to subscribe to stay informed about our latest resources and updates. Understanding the frequency of A1C testing is essential, as it relates to the A1C to average blood sugar chart and varies based on individual health circumstances. General guidelines suggest specific intervals based on the patient's care status:
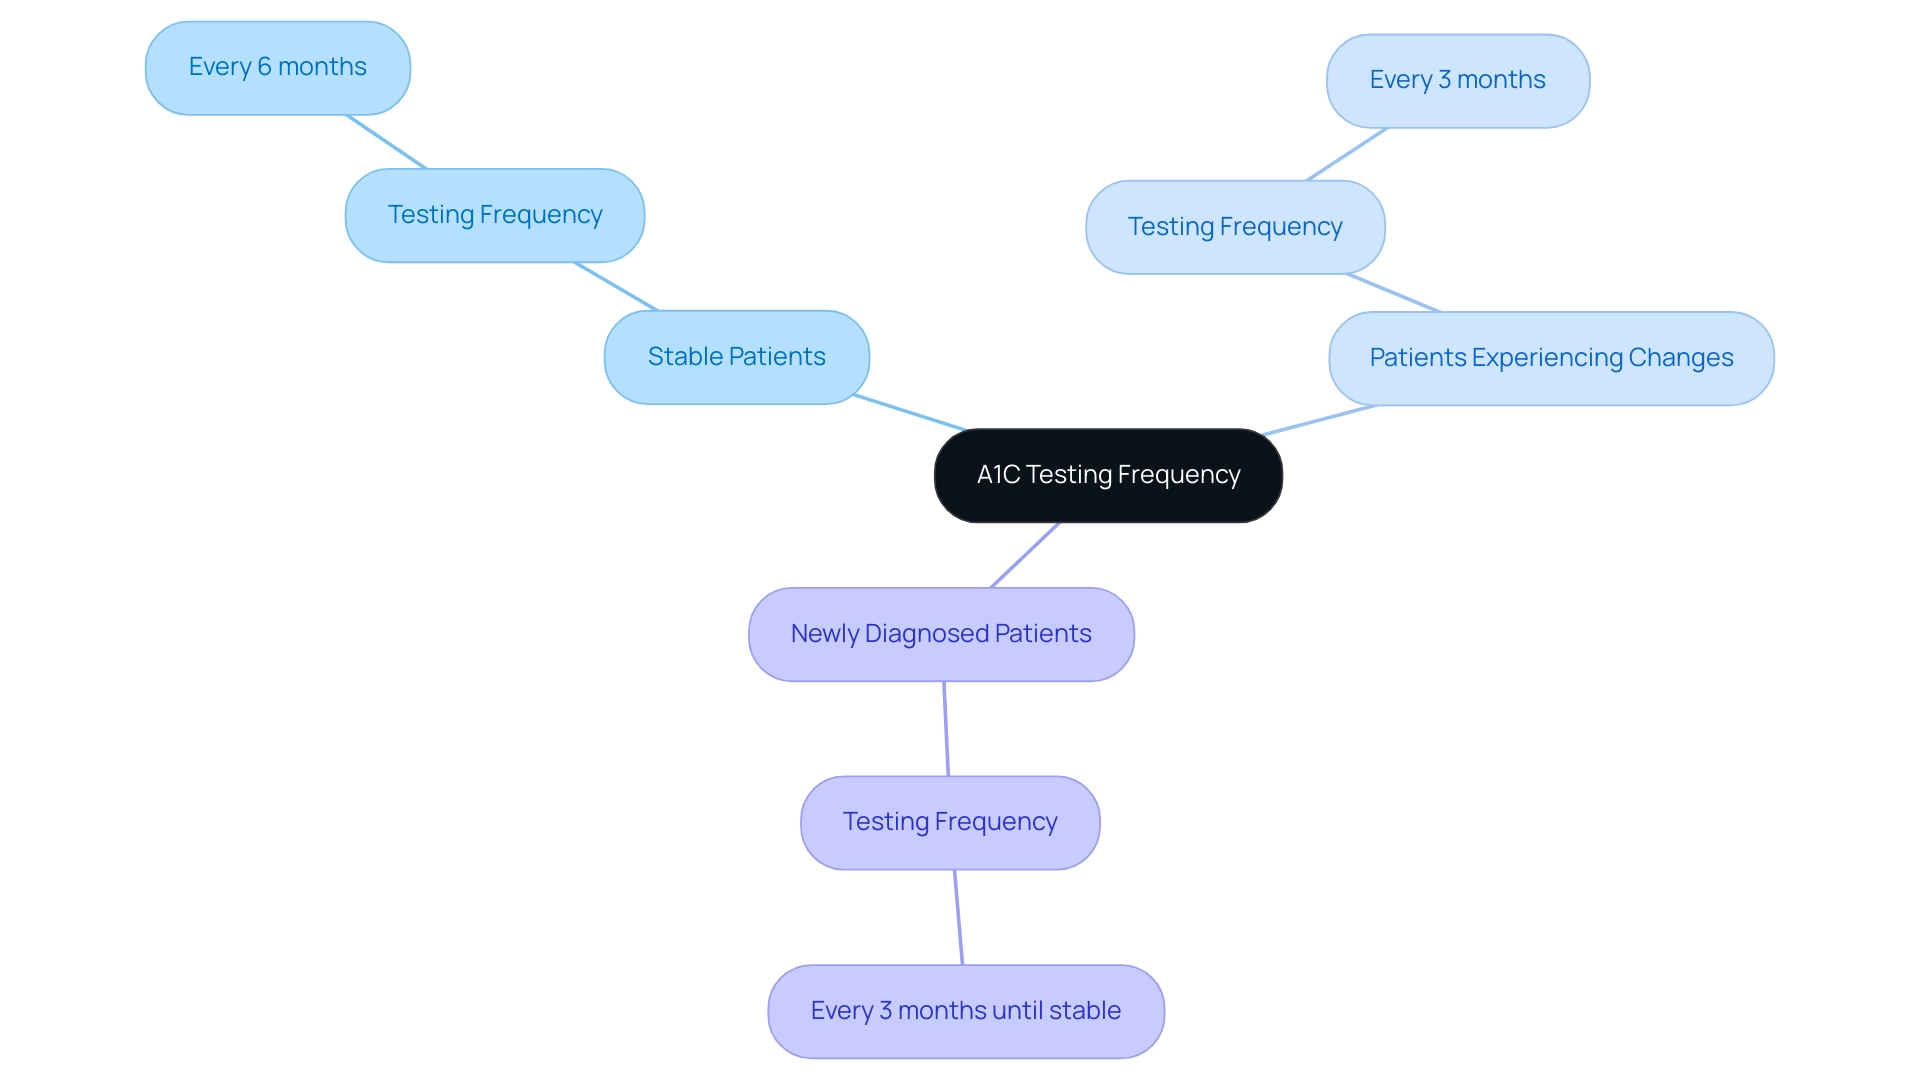
- For Stable Patients: Individuals whose condition is well-regulated and whose A1C readings consistently fall within the target range—typically below 7%—should undergo testing every six months.
- For Patients Experiencing Changes: Those facing alterations in their care approach, such as the initiation of new medications, lifestyle adjustments, or fluctuations in blood glucose readings, should consider more frequent testing, ideally every three months.
- For Newly Diagnosed Patients: Individuals newly diagnosed with the condition are advised to have their A1C tested every three months until they achieve stable blood sugar readings within the target range.
In light of the statistic that the hospitalization rate for hypoglycemia was 2.2 per 1,000 adults with the condition in 2020, regular A1C testing becomes crucial in preventing severe complications associated with the illness. At T2 Solutions, we emphasize the importance of engaging in discussions with healthcare providers to determine the appropriate testing schedule. As Bryan S. Quintanilla Rodriguez notes, 'Gestational hyperglycemia mellitus (GDM) is a form of hyperglycemia that develops during pregnancy and poses risks to both mother and fetus,' highlighting the importance of monitoring blood glucose levels for all patients.
This collaborative method guarantees that the A1C to average blood sugar chart is customized to meet the unique requirements of each patient, thereby enhancing health outcomes. Furthermore, the significant occurrence of prediabetes—97.6 million adults aged 18 years or older, constituting 38.0% of the adult U.S. population—highlights the need for effective oversight and testing, emphasizing the significance of customized A1C testing schedules as we aim to provide comprehensive resources through T2D Solutions. Don't forget to subscribe to our updates for more information and support as you navigate your health management journey.
Understanding Target A1C Goals
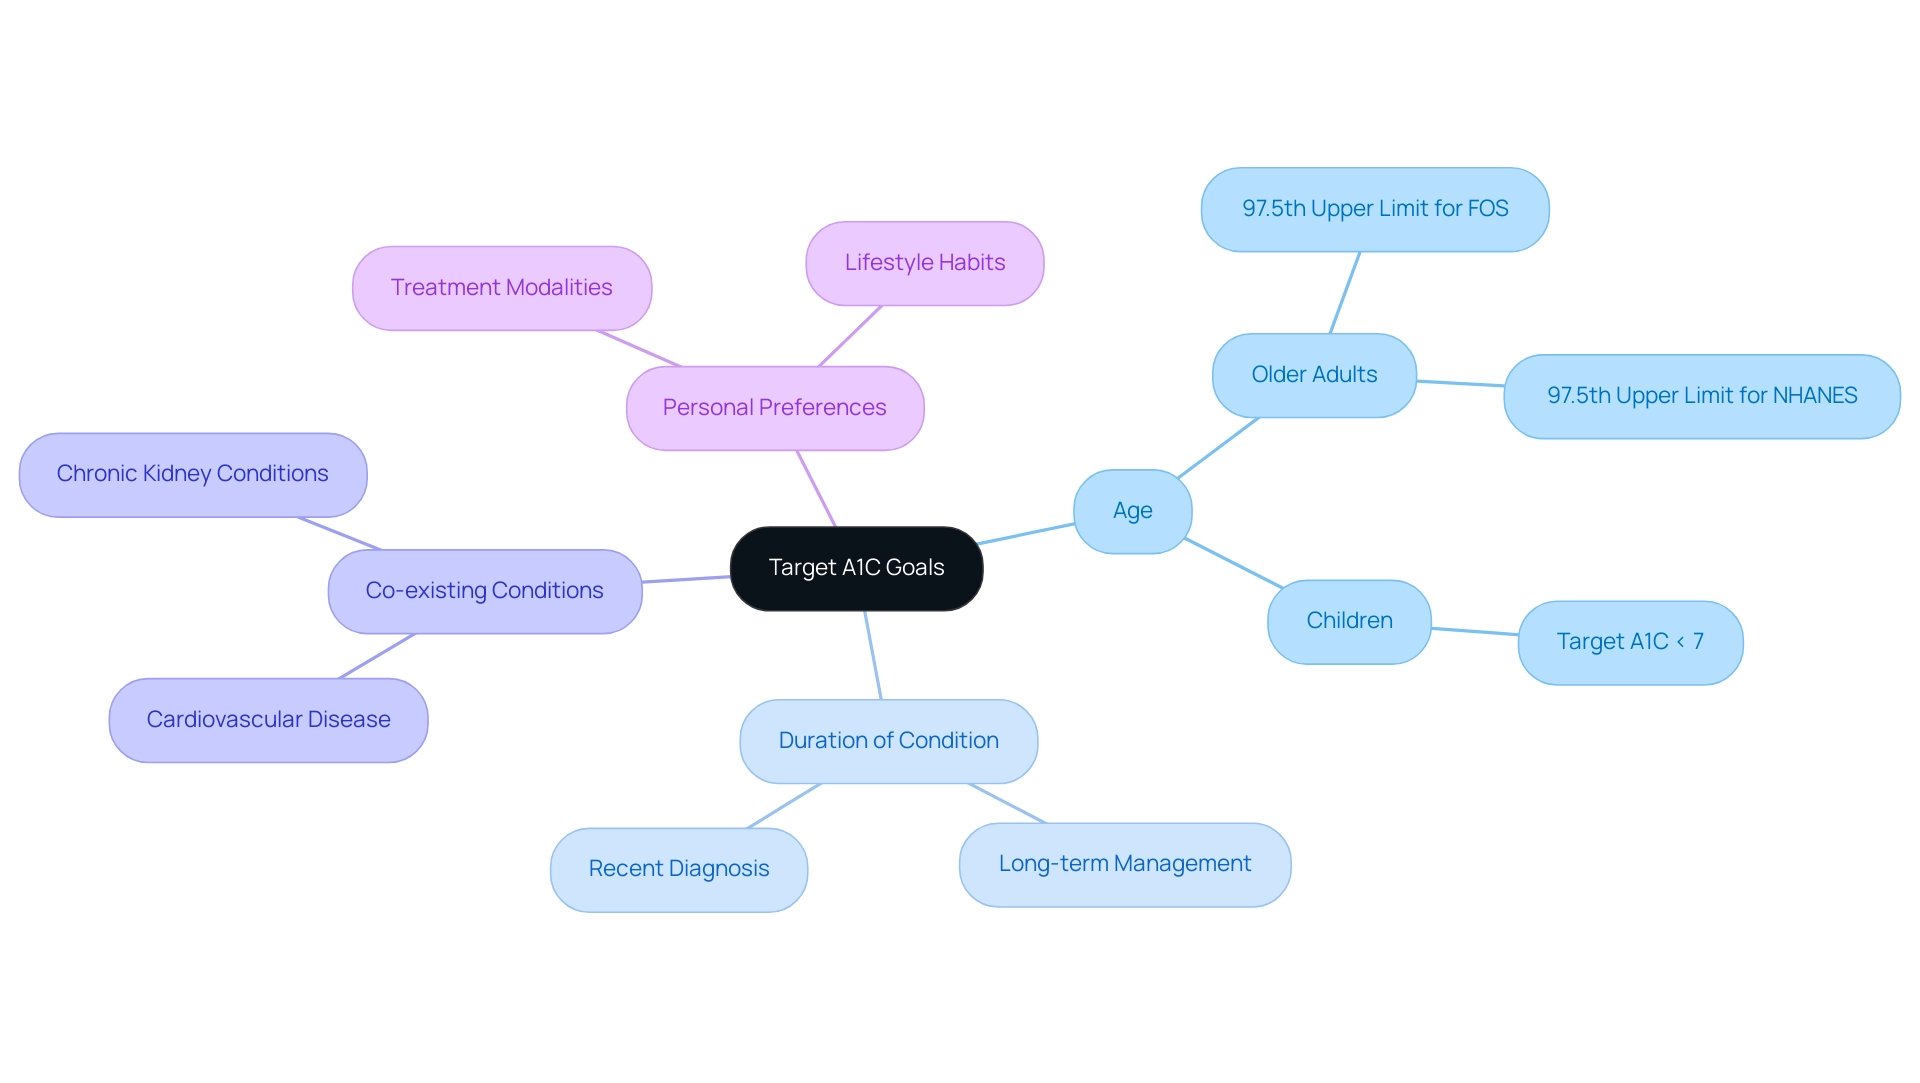
Target A1C goals can vary significantly based on individual health factors, as shown in the a1c to average blood sugar chart, and are not one-size-fits-all. For many adults managing this condition, the common target is an A1C level of less than 7%. However, several determinants can influence these goals, including age, where different age groups may require tailored targets; for instance, older adults often have relaxed goals to reduce the risk of treatment-related complications, which can be illustrated in the a1c to average blood sugar chart.
Notably, the 97.5th upper limits for A1C for participants aged ≥70 years are 6.61 for FOS and 6.20 for NHANES, indicating the need for careful consideration of targets in this demographic.
- Duration of Condition: Individuals who have managed their condition for an extended period may have either more stringent or lenient targets based on their unique health circumstances.
- Co-existing Conditions: The presence of additional health issues, such as cardiovascular disease or chronic kidney conditions, may require adjustments in the targets outlined in the A1C to average blood sugar chart.
- Personal Preferences and Lifestyle: Choices regarding treatment modalities and lifestyle habits play a crucial role in shaping A1C goals.
At T2DSolutions, we emphasize the importance of engaging in open dialogue with healthcare providers to establish personalized A1C targets that can be monitored using an a1c to average blood sugar chart, reflecting one’s holistic health objectives. Our mission is to empower newly diagnosed individuals with comprehensive resources and community support for effective health control. For example, in 2016, Kaiser Permanente Southern California adopted age-dependent therapeutic targets for hemoglobin A1C in their electronic health record system.
This initiative resulted in a reduction in medication adjustments for older adults, emphasizing the significance of personalized care in managing blood sugar according to the a1c to average blood sugar chart. Furthermore, the American Diabetes Association emphasizes that an A1C of less than 7% (53 mmol/mol) is appropriate for many children, illustrating the variability in targets based on age and health considerations. Additionally, ongoing initiatives are focused on addressing socioeconomic and racial/ethnic disparities in diabetes outcomes, underlining the necessity for personalized A1C targets in diverse populations.
Such personalized approaches are increasingly recognized as vital in addressing the diverse needs of patients. The data sources, including the U.S. Diabetes Surveillance System and the Behavioral Risk Factor Surveillance System, further support the discussion on A1C targets.
Conclusion
Understanding the A1C test is paramount for effective diabetes management. This essential tool not only measures average blood sugar levels but also provides critical insights that enable patients and healthcare providers to make informed decisions about treatment plans. With clear benchmarks for diabetes and prediabetes, the A1C test serves as a guide for ongoing management, highlighting the importance of regular monitoring.
Implementing lifestyle changes such as:
- A balanced diet
- Regular exercise
- Weight management
- Stress reduction
- Adequate sleep
can significantly improve A1C levels. These modifications are foundational for enhancing overall diabetes care and achieving better health outcomes. Moreover, recognizing that target A1C goals are individualized based on various factors—including age, duration of diabetes, and co-existing conditions—reinforces the necessity for personalized approaches in diabetes management.
Regular testing of A1C levels is crucial in maintaining optimal health, particularly for those newly diagnosed or experiencing changes in their diabetes management. By understanding the significance of A1C levels and engaging in proactive discussions with healthcare providers, individuals can take charge of their diabetes journey. As the prevalence of diabetes continues to rise, equipping oneself with knowledge and resources is essential for navigating this complex condition effectively.


