Overview
A diabetic conversion chart is an essential tool in managing diabetes. It helps you accurately interpret blood glucose readings by converting values between different measurement systems, such as mg/dL and mmol/L. This chart is not just about numbers; it enhances communication between you and your healthcare provider. By understanding these values better, you can feel empowered to take control of your health.
It's understandable to feel overwhelmed at times, but know that these charts can improve your understanding and adherence to treatment plans. This understanding can lead to better health outcomes, helping you feel more confident in your journey. Remember, you're not alone in this journey; we are here to support you every step of the way.
Introduction
In the journey of managing diabetes, understanding blood glucose levels is crucial. Diabetic conversion charts are invaluable tools that help bridge the gap between different measurement systems. They enable both patients and healthcare providers to accurately interpret glucose readings, which are essential for effective treatment and self-management.
It's understandable to feel overwhelmed by the information. Research shows that many individuals with diabetes rely on these charts, highlighting their role in enhancing communication and fostering patient confidence. These tools not only improve health outcomes but also empower you to take control of your health.
As diabetes care evolves, mastering these conversion tools becomes even more important. You're not alone in this journey; we are here to support you every step of the way. By understanding these resources, you can navigate your diabetes journey with greater ease and confidence.
Defining Diabetic Conversion Charts: A Key Tool in Diabetes Management
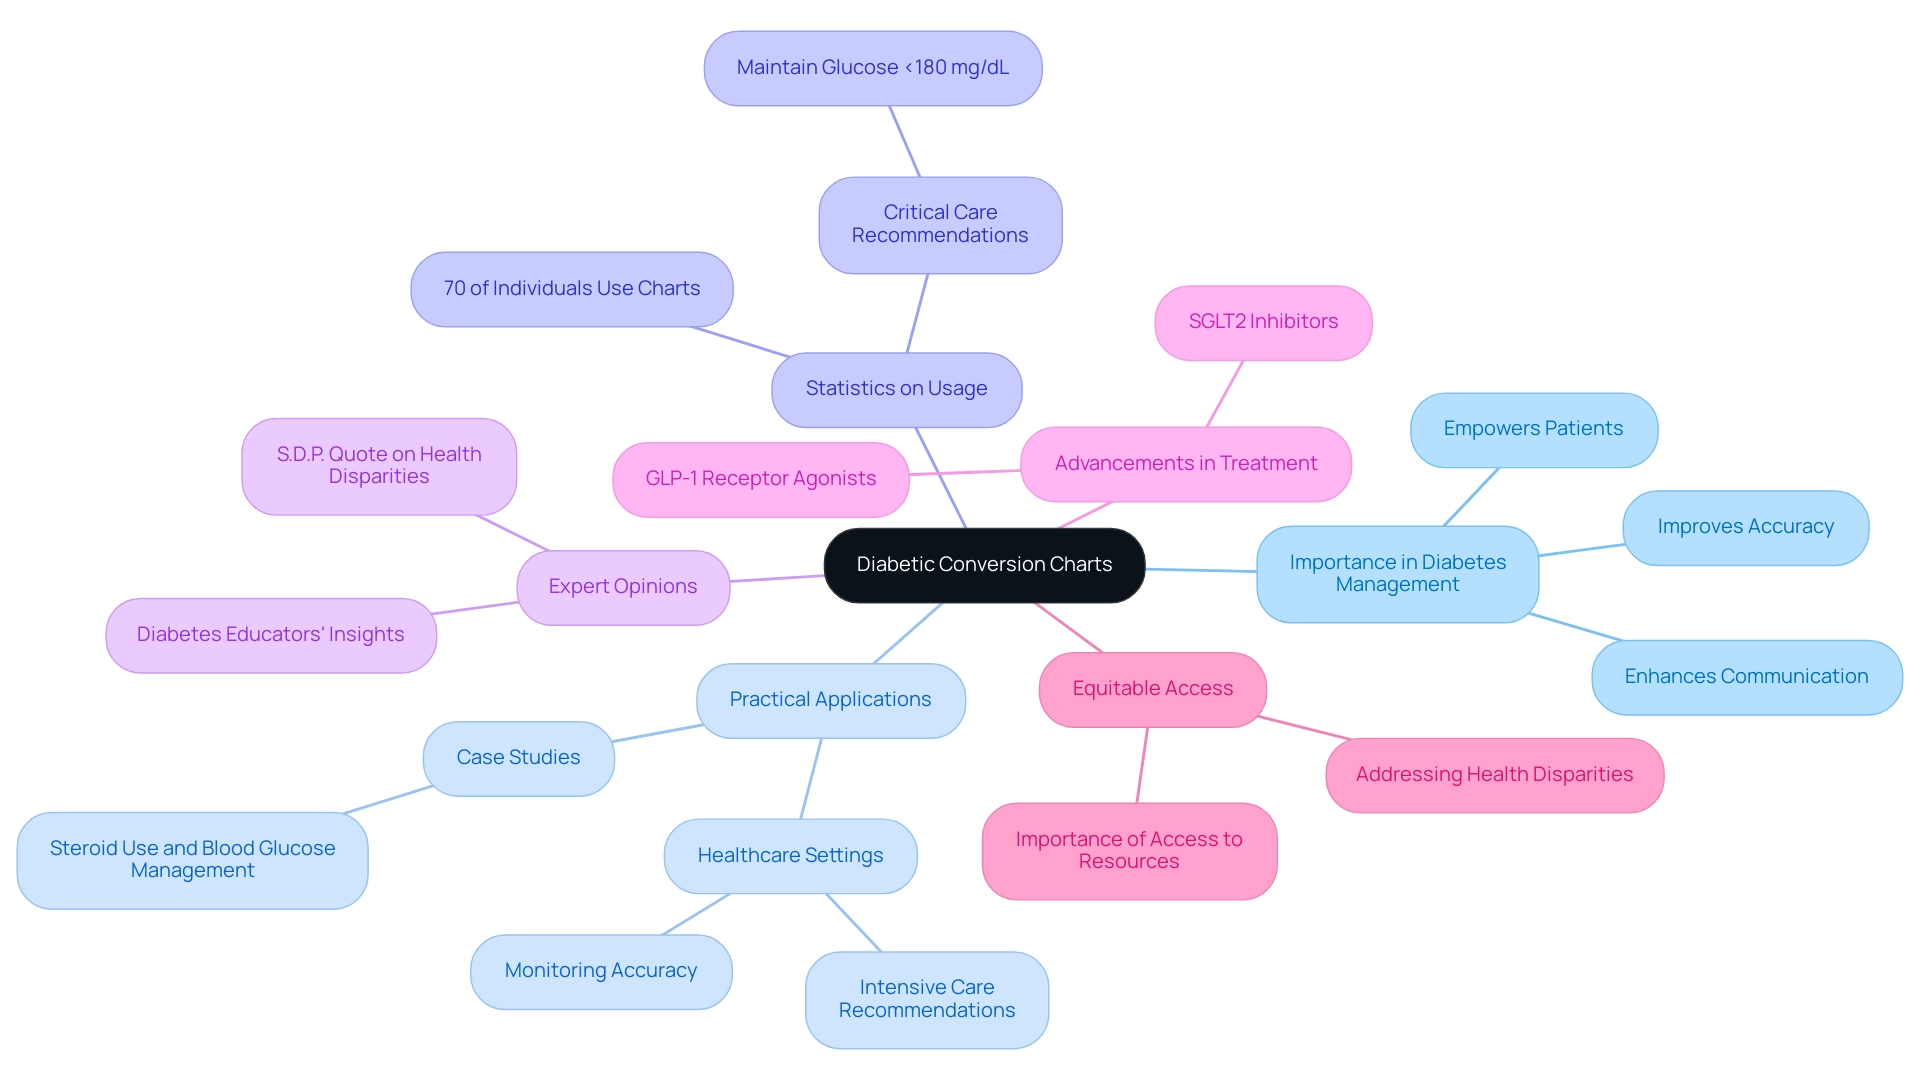
A diabetic conversion chart is more than just a tool; it’s an essential resource that helps individuals understand their blood glucose measurements. By translating values between milligrams per deciliter (mg/dL) and millimoles per liter (mmol/L), these charts are vital for those managing diabetes. It’s understandable to feel overwhelmed by the different measurement systems, but mastering these conversions can empower you to take charge of your health and communicate effectively with healthcare professionals about your glucose levels and treatment plans.
Practical applications of diabetic conversion charts have shown significant improvements in health outcomes. Studies reveal that healthcare settings that utilize these charts report greater accuracy in blood glucose monitoring, which leads to more informed treatment decisions. This is particularly crucial in intensive care environments, where the Society of Critical Care Medicine recommends maintaining glucose levels below 180 mg/dL to minimize complications.
Current statistics indicate that a large number of individuals with elevated blood sugar rely on diabetic conversion charts for accurate measurements. Approximately 70% of those facing blood sugar challenges use these resources to ensure they fully understand their glucose levels. This understanding is vital for effective self-care and meaningful interactions with medical professionals.
Experts emphasize the importance of diabetic conversion charts in managing blood sugar. Diabetes educators point out that these charts not only aid in understanding glucose levels but also foster confidence and independence in individuals managing their condition. By providing clear guidance on interpreting glucose readings, these resources empower you to make informed health choices.
Moreover, advancements in blood sugar management, such as sodium-glucose cotransporter 2 inhibitors (SGLT2i) and glucagon-like peptide 1 receptor agonists (GLP-1 RA), highlight the need for precise glucose management. These therapies are especially beneficial for high-risk individuals with type 2 diabetes, underscoring the necessity for reliable tools like conversion charts.
In summary, a diabetic conversion chart is a critical element of blood sugar management that enhances communication, accuracy, and patient empowerment. As diabetes care continues to evolve, the role of these charts is indispensable in ensuring you receive the best possible guidance and support on your health journey. Additionally, addressing health disparities in diabetes management is crucial, as emphasized by S.D.P., who advocates for equitable access to these vital resources for all individuals.
At A2D Solutions, we recognize the importance of these tools and are committed to providing resources that support effective management of diabetes. Remember, you’re not alone in this journey—we are here to support you every step of the way.
The Importance of Diabetic Conversion Charts in Effective Diabetes Management
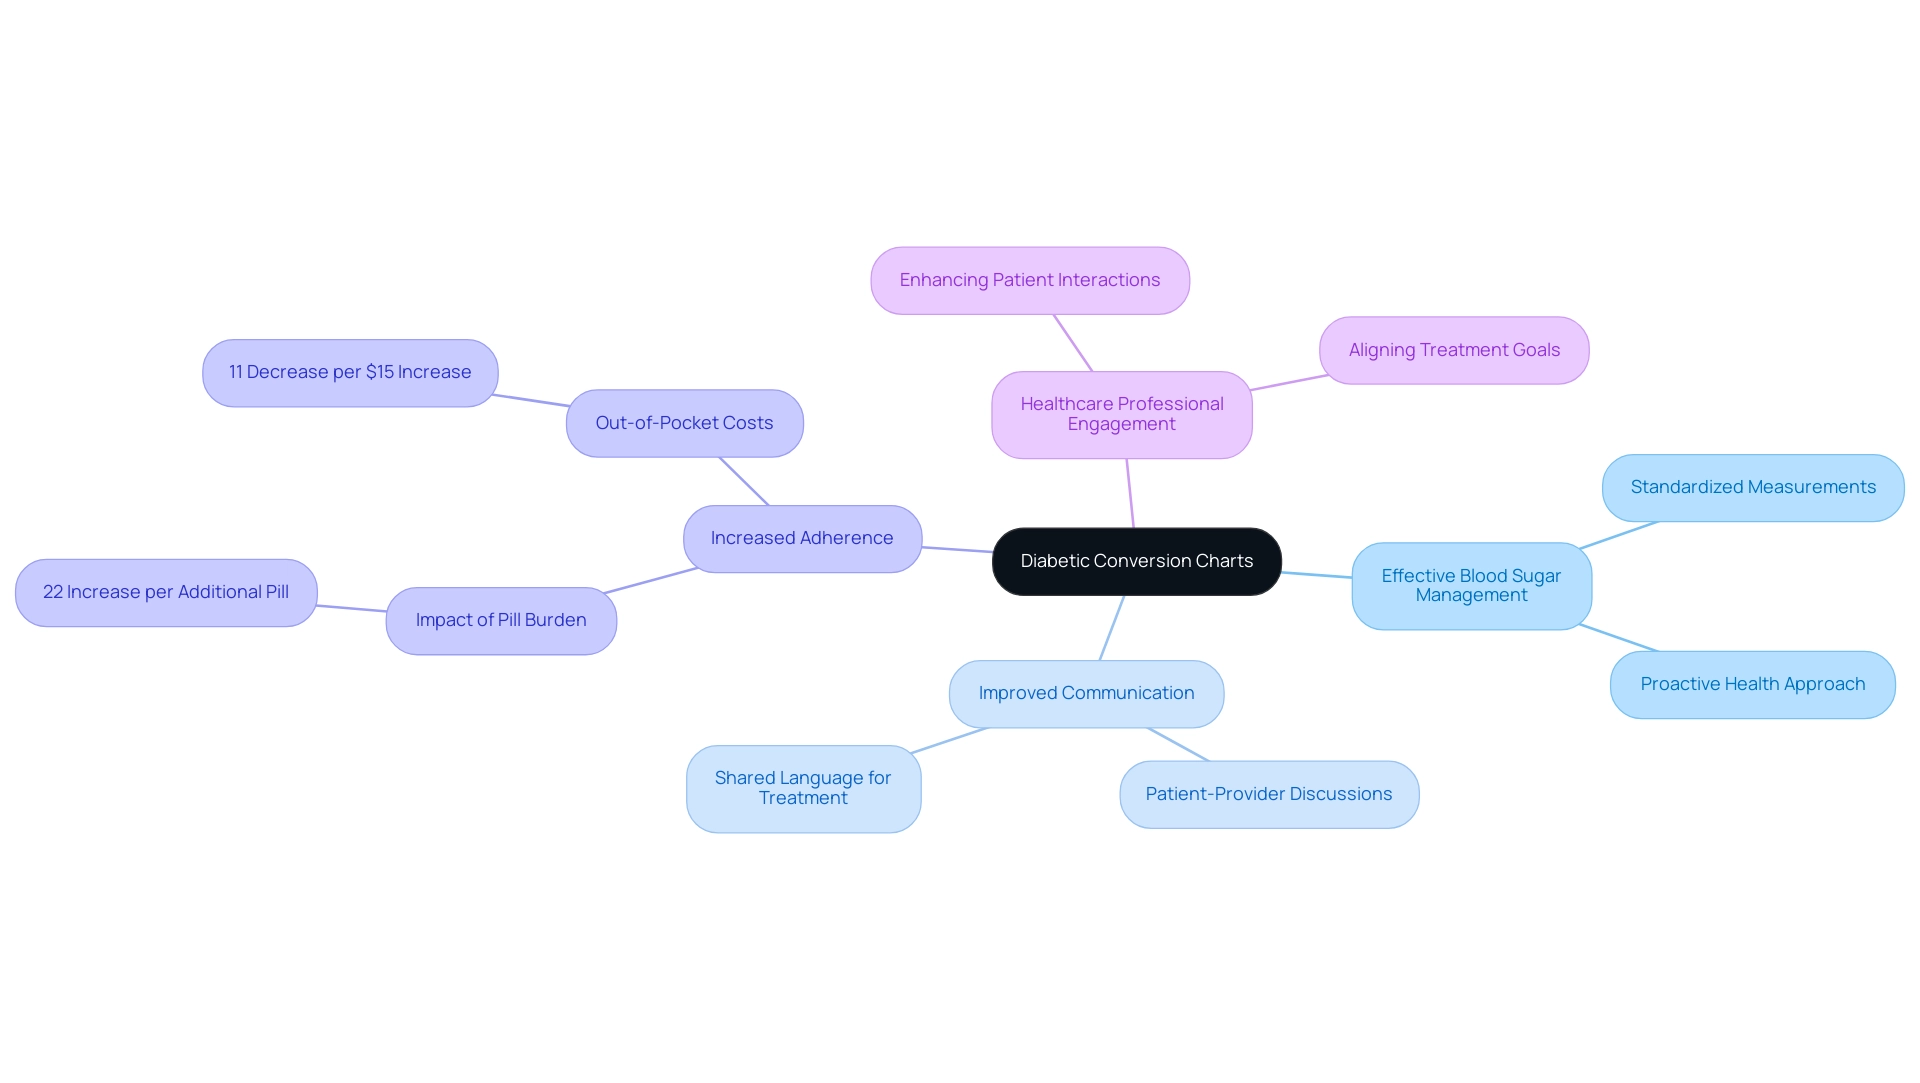
At T2DSolutions, we recognize that a diabetic conversion chart is a vital tool for effective blood sugar management. It offers a standardized way to interpret glucose readings, making it easier for individuals, especially when using different devices or transitioning between areas with various measurement systems. For example, a study with 380 participants revealed that adherence to diabetes medication increased by 22% for each additional pill taken daily. This highlights the importance of clear communication about treatment plans.
By utilizing measurement tables, individuals can gain a better understanding of their glucose levels, which encourages a proactive approach to their health.
For healthcare professionals, these diagrams significantly enhance interactions with individuals, ensuring alignment on treatment goals and necessary adjustments. This clarity is essential, as effective communication has been shown to improve adherence to treatment plans, ultimately leading to better health outcomes. Additionally, incorporating transformation tables into healthcare can enrich discussions about medication compliance. Studies indicate that increased out-of-pocket expenses can negatively impact adherence by 11% for every extra $15 spent monthly.
At T2DSolutions, we are committed to providing these essential resources to individuals newly diagnosed with diabetes, helping them navigate their management journey. The role of diabetic transformation diagrams extends beyond personal interactions; they also facilitate broader conversations about blood sugar management. By offering a shared language for both patients and providers, these tools enhance the overall quality of communication, making it easier to address concerns and adjust treatment strategies as needed.
As R.E.A., the guarantor of a related study, stated, "I had full access to all the data in the study and take responsibility for the integrity of the data and the accuracy of the data analysis." This statement underscores the importance of reliable data in understanding medication adherence.
In summary, a diabetic conversion chart is not just a measurement tool; it is a crucial element that enhances understanding, adherence, and communication in managing blood sugar conditions. The results from logistic regression analysis, which showed a satisfactory model fit with a C-statistic of 0.73, further emphasize the necessity for these visuals in addressing the complexities of managing blood sugar conditions. T2DSolutions is dedicated to being a comprehensive resource for education on diabetes-related issues, ensuring that individuals have access to the information they need to manage their health effectively.
Types of Diabetic Conversion Charts: A Comprehensive Overview
Managing diabetes involves a variety of tools, and the diabetic conversion chart is essential in helping patients and healthcare providers navigate their care effectively. At T2DSolutions, we are committed to providing extensive resources for diabetes education and community support, including access to vital reference tables. Understanding the different types of diabetic transformation tables can empower you in your journey.
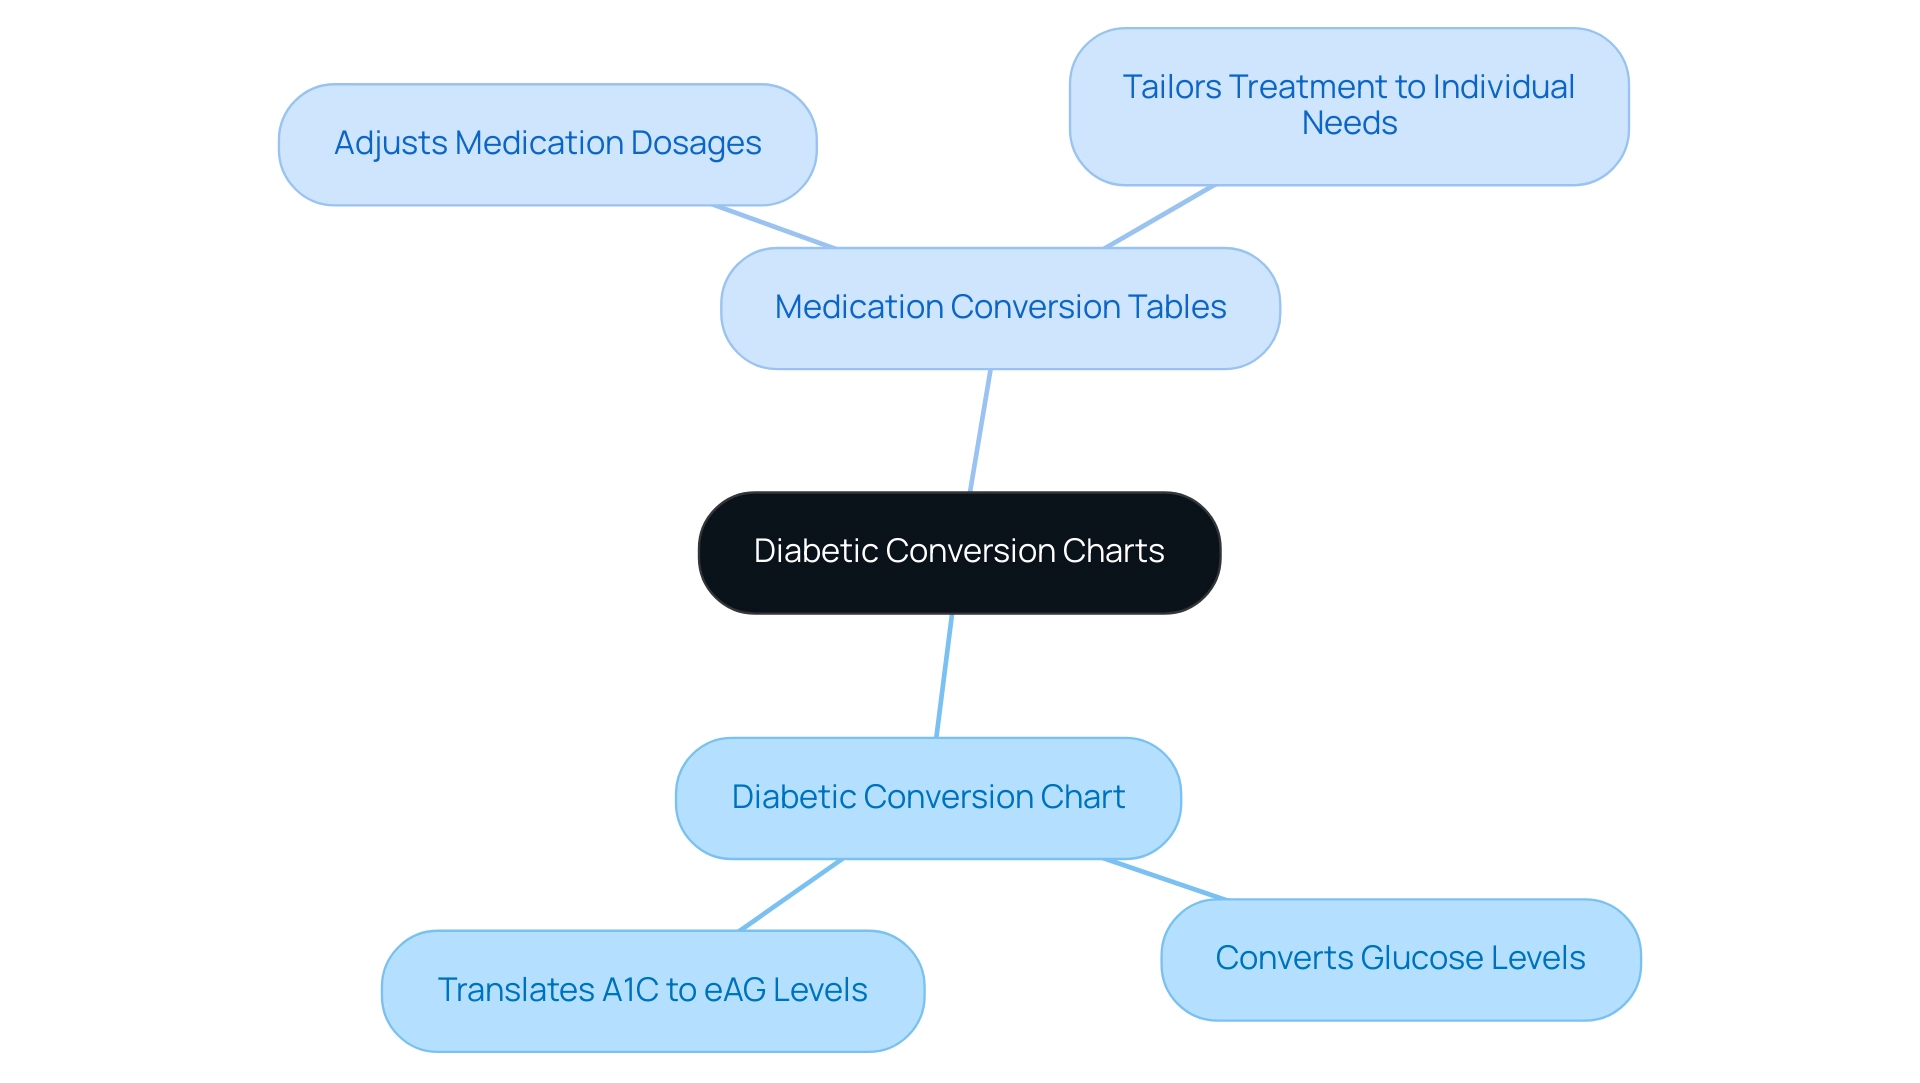
Diabetic Conversion Chart: These charts are crucial for converting glucose levels between mg/dL and mmol/L, enabling individuals to interpret their readings accurately, no matter the measurement system used. This is particularly important as different regions may utilize distinct units. By understanding these conversions, you can manage your blood sugar levels more effectively. The diabetic conversion chart also translates A1C percentages into estimated average glucose (eAG) levels, offering a clearer perspective on long-term glucose control. The American Diabetes Association recommends maintaining an A1C of 7% or lower for most adults with diabetes, making it vital for you to understand how your A1C relates to daily glucose levels.
Medication Conversion Tables: These tables assist healthcare professionals in adjusting dosages of blood sugar medications based on individual needs and responses. This ensures that you receive the most suitable care tailored to your unique situation, which is crucial for effective management of your condition.
By understanding these various types of charts, both you and your healthcare provider can utilize the most relevant resources for effective management of your health. For instance, a recent study highlighted the rising prevalence of blood sugar issues among youth and teenagers, emphasizing the need for targeted educational initiatives that include these transformation tools. When you have the knowledge to interpret your glucose and A1C levels, you can take proactive steps in your health journey.
Moreover, experts emphasize that controlling blood sugar levels is vital for managing diabetes, as effective self-management can significantly improve both short- and long-term health outcomes. This underscores the importance of incorporating a diabetic conversion chart into a comprehensive management strategy. Additionally, the challenges posed by complications such as diabetic neuropathy further illustrate the necessity of effective management tools.
By fostering a community that shares experiences and supports one another, you can navigate your health journey together, enhancing overall health outcomes. T2DSolutions is here to support you with these resources and more, ensuring you have the tools needed for effective blood sugar management.
How to Read and Interpret Diabetic Conversion Charts
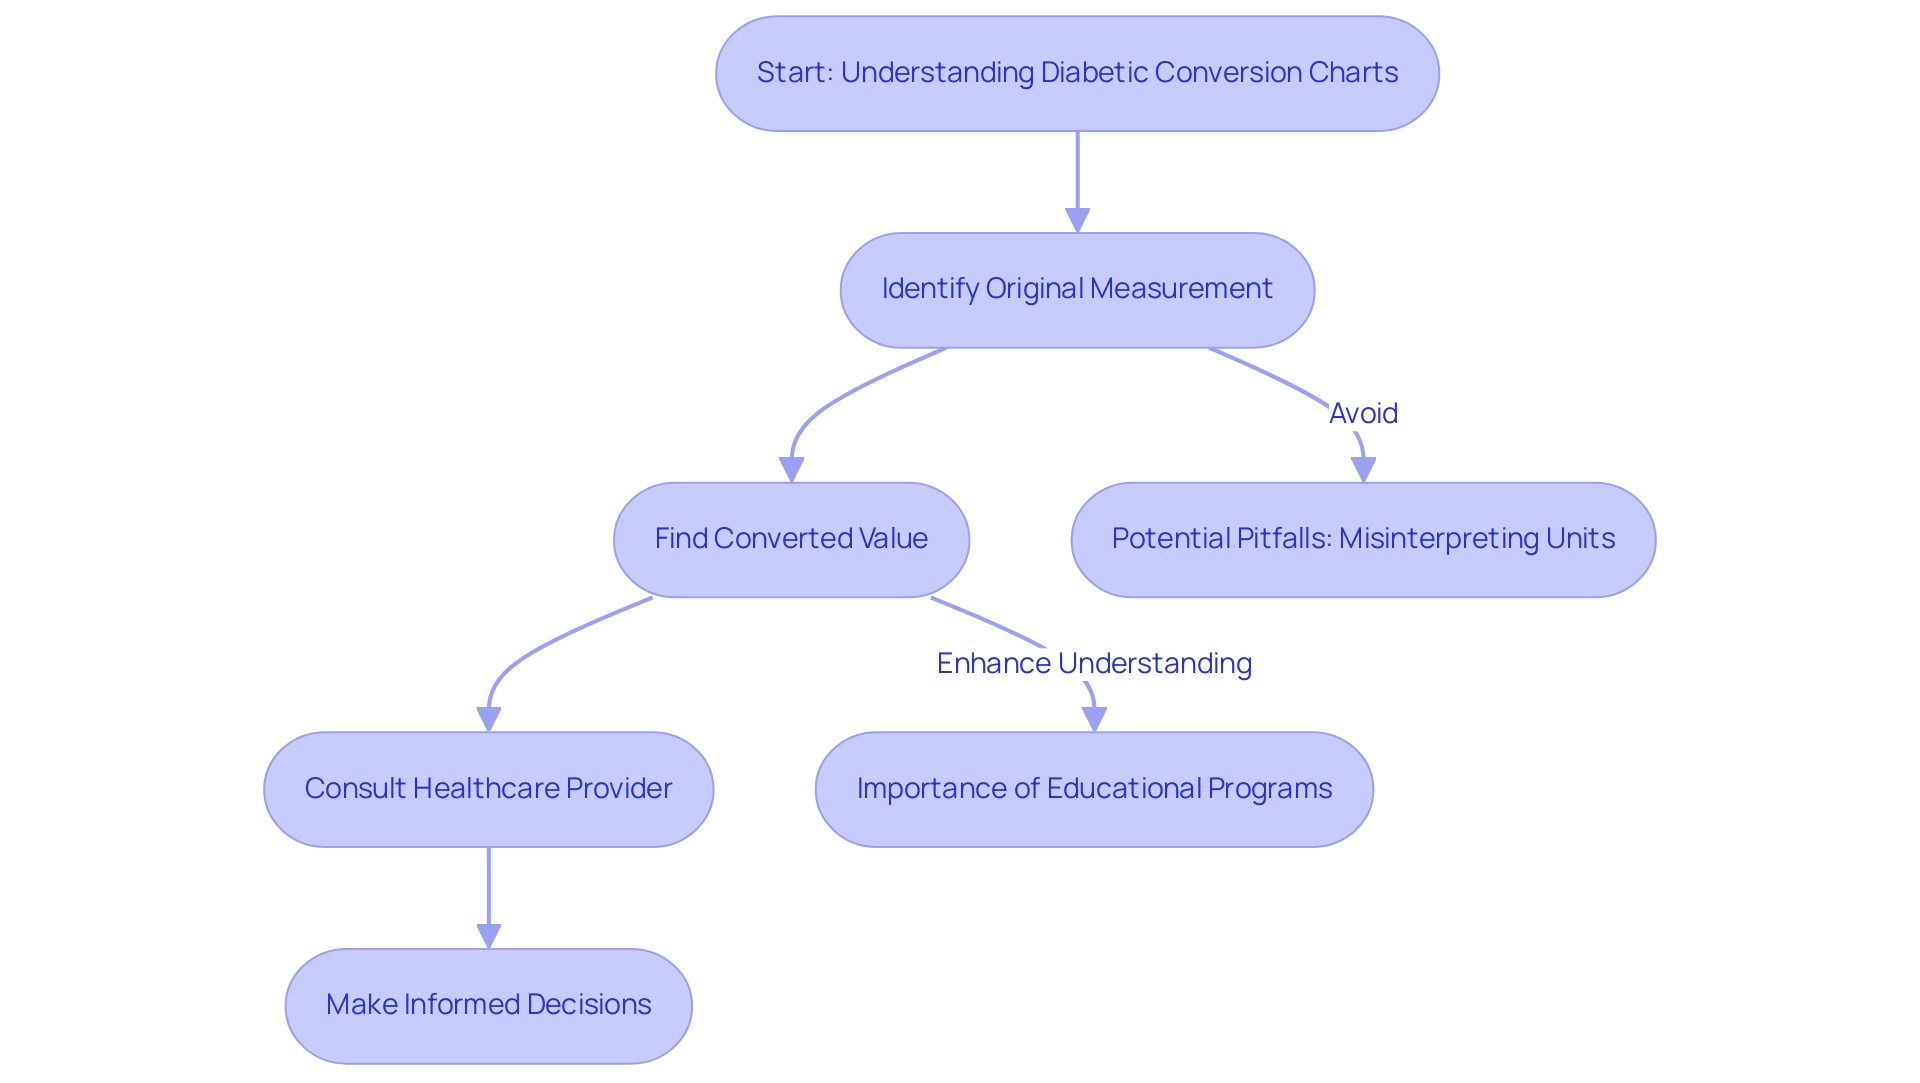
Understanding and interpreting the diabetic conversion chart is crucial for effective diabetes management. These diagrams typically feature two columns: one for the original measurement and another for the converted value. For example, a diabetic conversion chart may show that a blood glucose reading of 100 mg/dL corresponds to 5.6 mmol/L.
It’s important to familiarize yourself with the specific chart you’re using. This knowledge allows you to accurately translate your measurements and understand their significance in managing your health.
Consulting with healthcare providers is vital to ensure that your interpretations of these charts align with your personal health goals. Studies indicate that around 60% of individuals with diabetes seek advice from healthcare professionals regarding the use of conversion tables. This highlights the importance of expert support in navigating your journey.
When using diabetic reference materials, be mindful of common pitfalls. Misinterpreting units of measurement or overlooking variations in individual health conditions can lead to confusion. For instance, understanding that a standard deviation (SD) of 50 mg/dL with an average glucose of 150 mg/dL results in a coefficient of variation (CV) of 33% can help you appreciate the variability in your readings and the need for consistent monitoring.
To read and interpret the diabetic conversion chart effectively, focus on its layout and ensure you know how to navigate the information provided. Participating in educational programs can offer valuable insights into applying these diagrams in your daily life. For example, case studies reveal that patients who receive targeted education on reading and interpreting the diabetic conversion chart show a 40% improvement in their understanding and application of this information.
Expert guidance from health educators emphasizes that therapy decisions should not rely solely on one metric. As Dr. Rich Bergenstal notes, "Therapy choices should not rely solely on one metric," stressing the need for a comprehensive approach to managing diabetes that considers various data points and individual factors. Additionally, the notable increase in Type 2 diabetes incidence among children and adolescents from 2002 to 2018 underscores the urgency of effective management strategies for all age groups.
Moreover, the challenges faced in inpatient glycemic management, as highlighted in relevant case studies, illustrate the complexities of interpreting diabetic transition graphs in clinical settings. Recognizing the limitations of retrospective analyses, such as arbitrary sample grouping, is essential for grasping the broader context of managing diabetes. By promoting a deeper understanding of diabetic transition guides, you can enhance your self-management skills and make informed choices about your health.
Understanding A1C and Blood Glucose: The Connection Explained
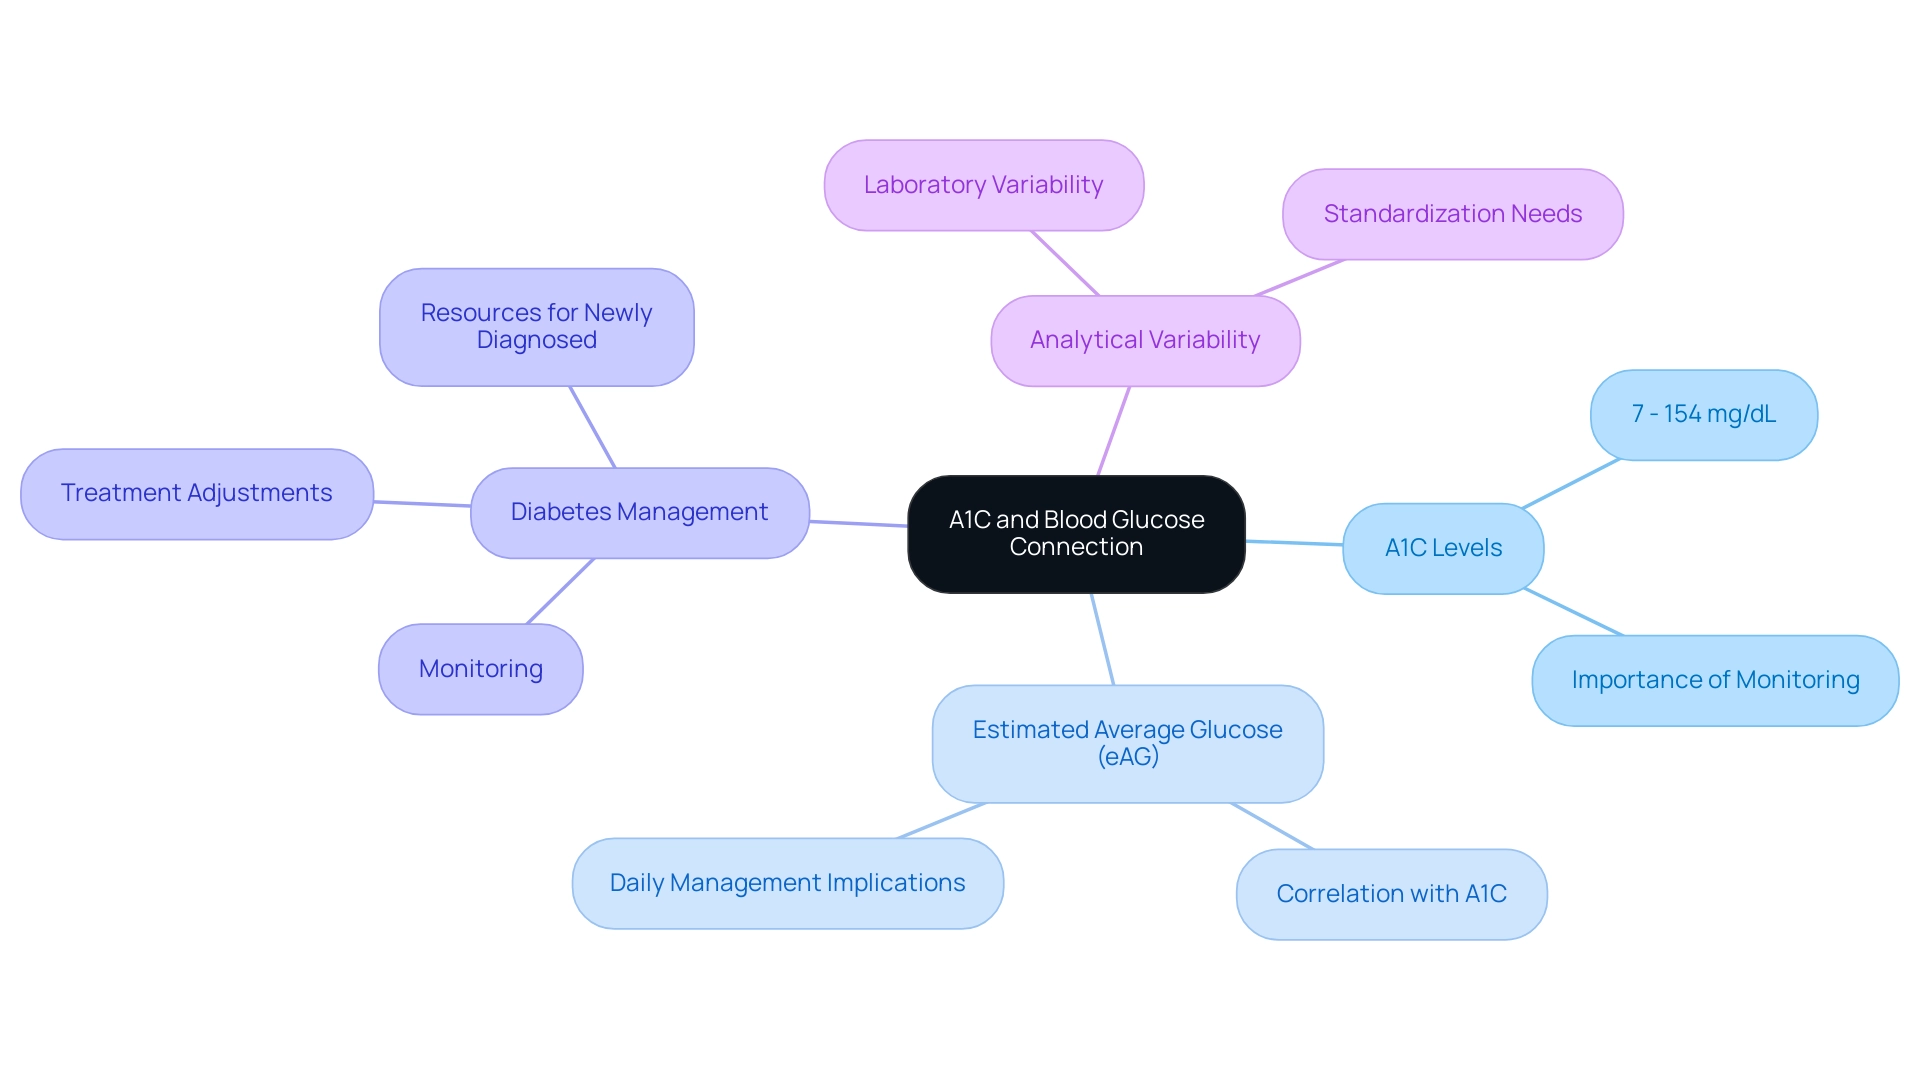
The A1C test is a vital tool in managing diabetes, measuring your average blood glucose levels over the past two to three months. This test offers a comprehensive overview that daily glucose readings alone cannot provide. At A2D Solutions, we understand how important diabetic conversion charts are. These charts illustrate the relationship between A1C percentages and estimated average glucose (eAG) levels, helping you visualize how your long-term glucose control translates into daily management.
For instance, an A1C of 7% corresponds to an eAG of approximately 154 mg/dL, highlighting the direct connection between these two metrics.
Recent studies emphasize the importance of grasping this relationship. They reveal that averaging glucose values leads to better correlations with HbA1c. Significant findings from the Diabetes Control and Complications Trial (DCCT) have established a strong link between HbA1c levels and glucose measurements. This reinforces the need for you to monitor both metrics closely.
Moreover, expert opinions stress the significance of the A1C test in diabetes management. Endocrinologists recommend its use as a point-of-care test, providing immediate insights into your glucose control. As Roopa Naik notes, the HbA1c test can be performed as a point of care (POC), a STAT test, or by sending a sample to a laboratory.
This immediacy allows for timely adjustments in treatment plans, ultimately enhancing outcomes for individuals like you.
Case studies have also highlighted the analytical variation in glucose measurement. While variability among laboratories is lower than biological variability, discrepancies can still occur. Such variations can lead to misclassification of blood sugar status, emphasizing the necessity for standardization in glucose testing practices. The case study titled "Analytical Variation in Glucose Measurement" details the methods used in laboratories and the potential for variability in results due to differences in measurement techniques and equipment.
By utilizing the diabetic conversion chart, you can set realistic goals for your daily glucose monitoring. This reinforces the importance of maintaining consistent blood sugar levels. Understanding this not only empowers you in your health management journey but also fosters a proactive approach to achieving better health outcomes. At T 2 Solutions, we are committed to providing resources and support for newly diagnosed individuals, helping you grasp the significance of A1C levels in your management strategies.
Additionally, with 5,293 newly diagnosed cases of type 2 blood sugar disorder among children and adolescents aged 10 to 19 years reported in 2017-2018, it is crucial for newly diagnosed patients to understand the importance of A1C levels in their management strategies. Furthermore, ongoing research into the cost-effectiveness and practical use of A1C in diabetes management highlights the evolving landscape of diabetes care.
Using Diabetic Conversion Charts for Self-Monitoring and Management
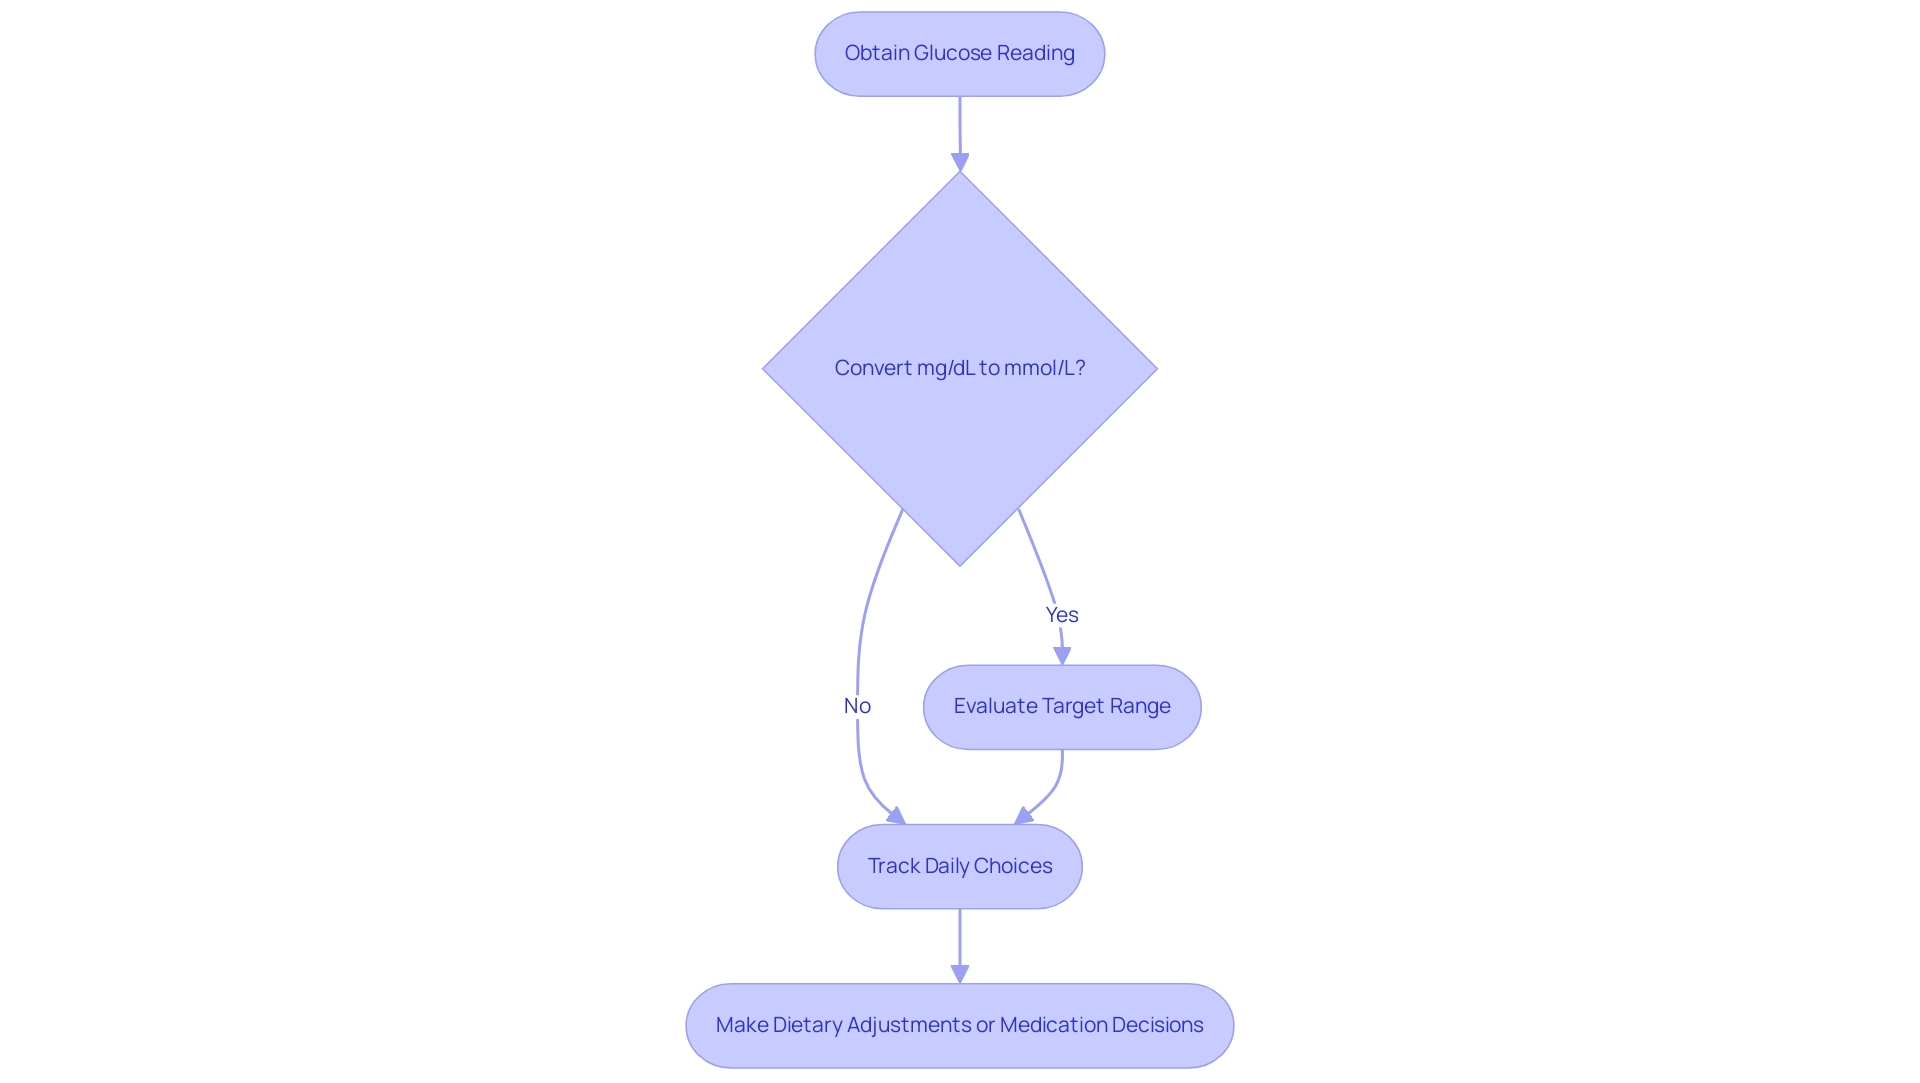
A diabetic conversion chart is an essential tool for individuals managing their blood glucose levels. By consistently tracking their glucose measurements and utilizing these graphs, individuals can gain valuable insights into how their daily choices affect their blood sugar levels. For instance, a reading of 180 mg/dL can be swiftly converted to mmol/L using the diabetic conversion chart. This enables individuals to evaluate whether they fall within their target range.
This practice not only facilitates immediate decision-making regarding dietary adjustments and medication but also empowers individuals by allowing them to track their progress over time.
At T2DSolutions, we understand the significance of these tools in managing blood sugar. Our resource center is designed to assist those recently diagnosed by offering access to comprehensive blood sugar and glucose transformation tables, along with educational materials that enhance understanding of managing the condition.
Research indicates that effective self-monitoring can significantly improve diabetes management. In fact, at blood glucose levels exceeding 4.2 mmol/L, a variance of less than 15% between self-monitoring blood glucose (SMBG) readings and simultaneous venous fasting plasma glucose is deemed acceptable. This statistic highlights the importance of precise monitoring and the role that diabetic conversion charts play in enabling individuals to make informed choices regarding their health.
As noted, "Half your glucose values are above the median and 50% of your glucose values are below the median. The median is the middle value and serves as a kind of average, emphasizing the significance of comprehending these values in monitoring individuals."
Despite the clear benefits, current diabetes care practices often overlook the detailed analysis of SMBG data. Many patients lack access to the necessary technology, and healthcare providers frequently do not have the time to analyze this data thoroughly. However, incorporating electronic logbooks and transformation tables into daily routines can lead to enhanced glycemic control, as demonstrated by various studies.
Standardizing reports can minimize confusion and misinterpretation, but a balance between customization and standardization is needed to ensure clear communication in managing blood sugar conditions.
Practical examples demonstrate the effectiveness of conversion tables in everyday blood sugar management. Patients who regularly use these tools report feeling more in control of their condition, as they can visualize the relationship between their lifestyle choices and blood glucose levels. This empowerment is crucial, especially for newly diagnosed individuals who may feel overwhelmed by their diagnosis.
Furthermore, data from the SEARCH for Diabetes in Youth study indicates a significant increase in the occurrence of type 1 and type 2 conditions among children and adolescents, underscoring the urgent need for targeted interventions and education to prevent such issues in younger populations.
In summary, the use of diabetic conversion charts not only assists individuals in self-monitoring blood glucose levels but also promotes a proactive approach to managing their condition. By understanding their glucose readings and the factors influencing them, individuals can take charge of their health, leading to better outcomes and a more fulfilling life. Remember, you're not alone in this journey—T2DSolutions is here to support you, providing the resources you need to manage your diabetes effectively.
The Role of Conversion Charts in Clinical Diabetes Care
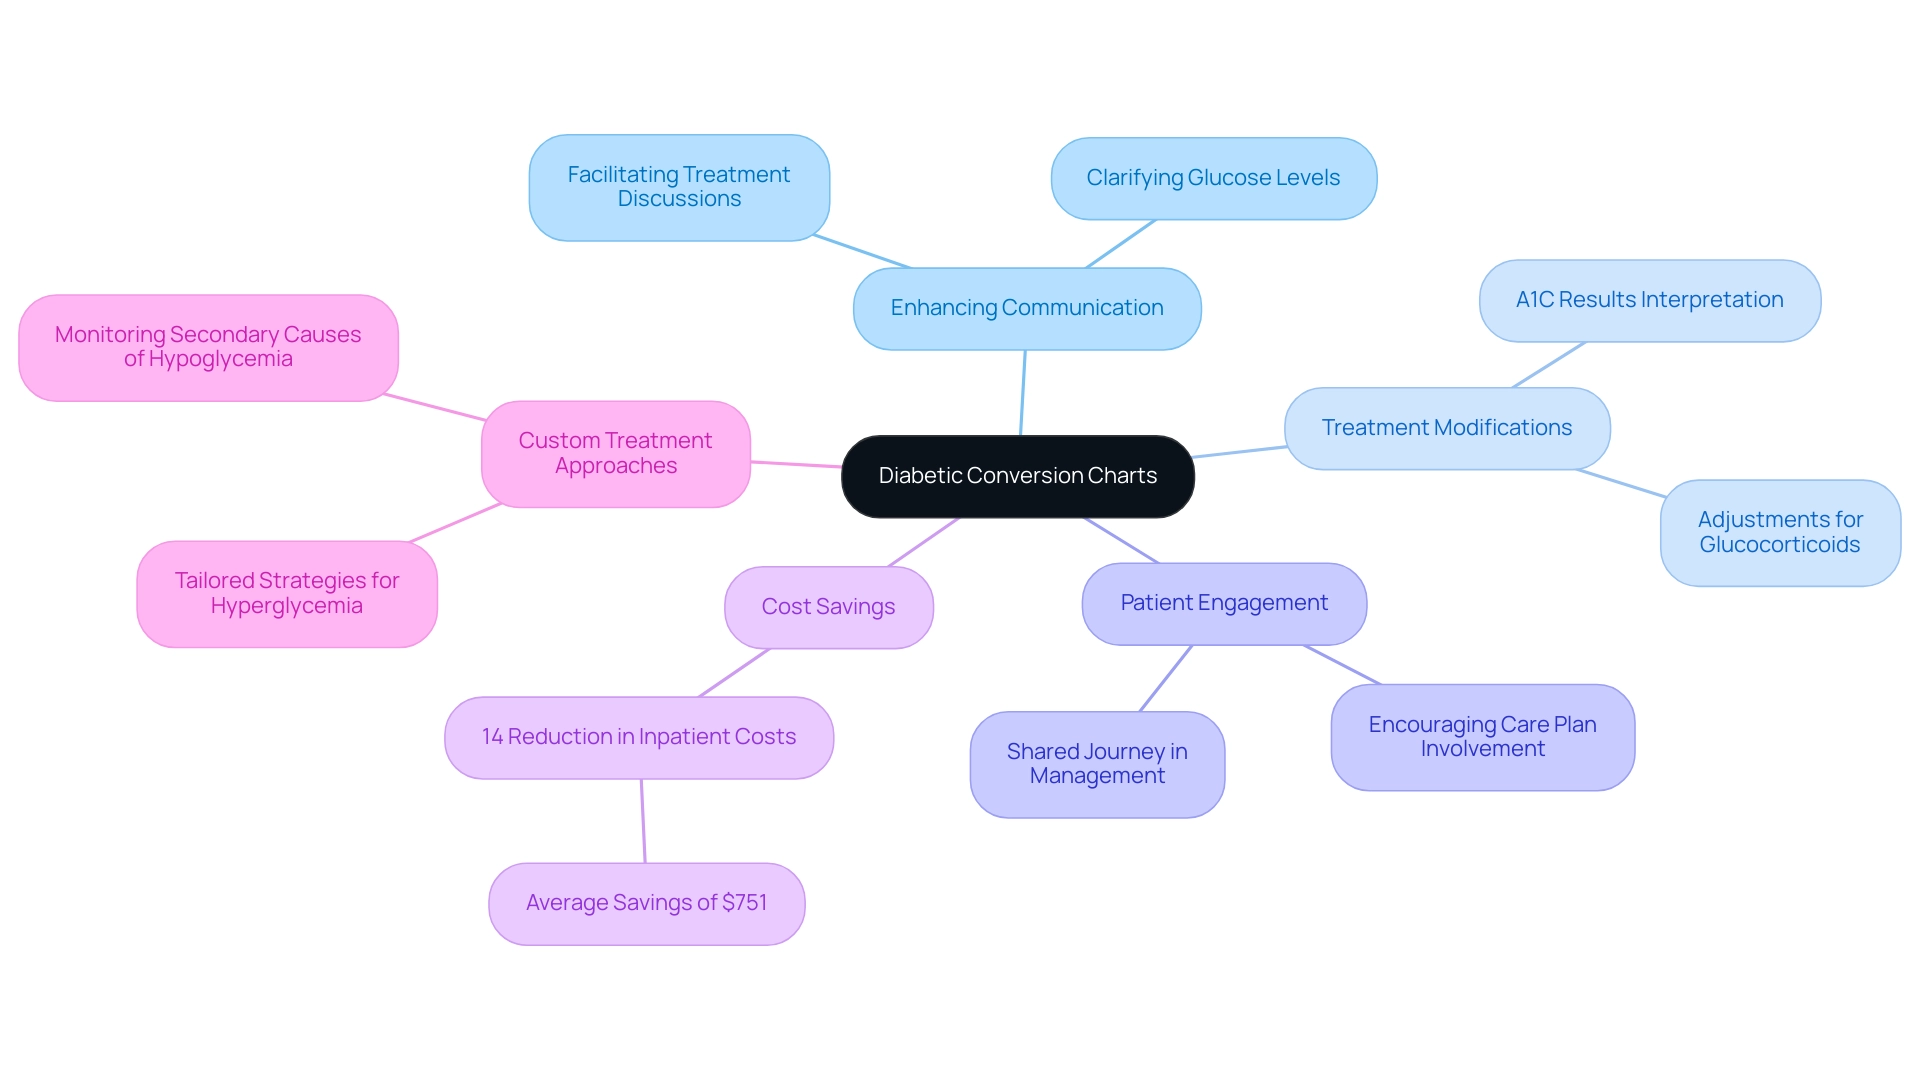
In clinical environments, the diabetic conversion chart serves as an essential tool that significantly enhances communication between healthcare professionals and individuals. These graphs help clarify glucose levels and treatment modifications in a way that is easy to understand. For instance, when discussing an individual's A1C results, a provider can use a diabetic conversion chart to illustrate how these results relate to daily glucose monitoring.
This visual representation not only simplifies complex information but also encourages individuals to engage in their care plans. This involvement is crucial for improving adherence and health outcomes.
Research shows that effective glucose control can lead to considerable cost savings in healthcare. For example, a basal-bolus regimen can reduce average total inpatient costs per day by 14%, or about $751. This underscores the importance of clear communication and education in diabetes management, particularly when using a diabetic conversion chart. A recent study also highlighted that 12.8% of hospitalized individuals were on glucocorticoids, which can significantly affect blood glucose levels.
This emphasizes the need for customized treatment approaches and careful supervision. The diabetic conversion chart can play a vital role in guiding both individuals and providers. As Dhatariya K. noted, "the systems may not also be able to cope with the acute changes that occur in the hospital," which highlights the necessity for effective communication during these critical times.
Additionally, hyperglycemia often arises from increased hepatic glucose production and impaired glucose utilization in peripheral tissues, complicating the management of the condition. By incorporating a diabetic conversion chart into patient education, healthcare providers can enhance understanding and involvement, ultimately leading to better health outcomes. This collaborative approach to managing the condition, supported by these tools, reinforces the idea that overseeing this illness is a shared journey, where knowledge and effective communication are essential for success.
Furthermore, understanding secondary causes of inpatient hypoglycemia can broaden the conversation around the complexities of managing blood sugar conditions in clinical settings. This highlights the importance of using a diabetic conversion chart to address these challenges. You're not alone in this journey; we are here to support you every step of the way.
Debunking Myths: Common Misunderstandings About Diabetic Conversion Charts
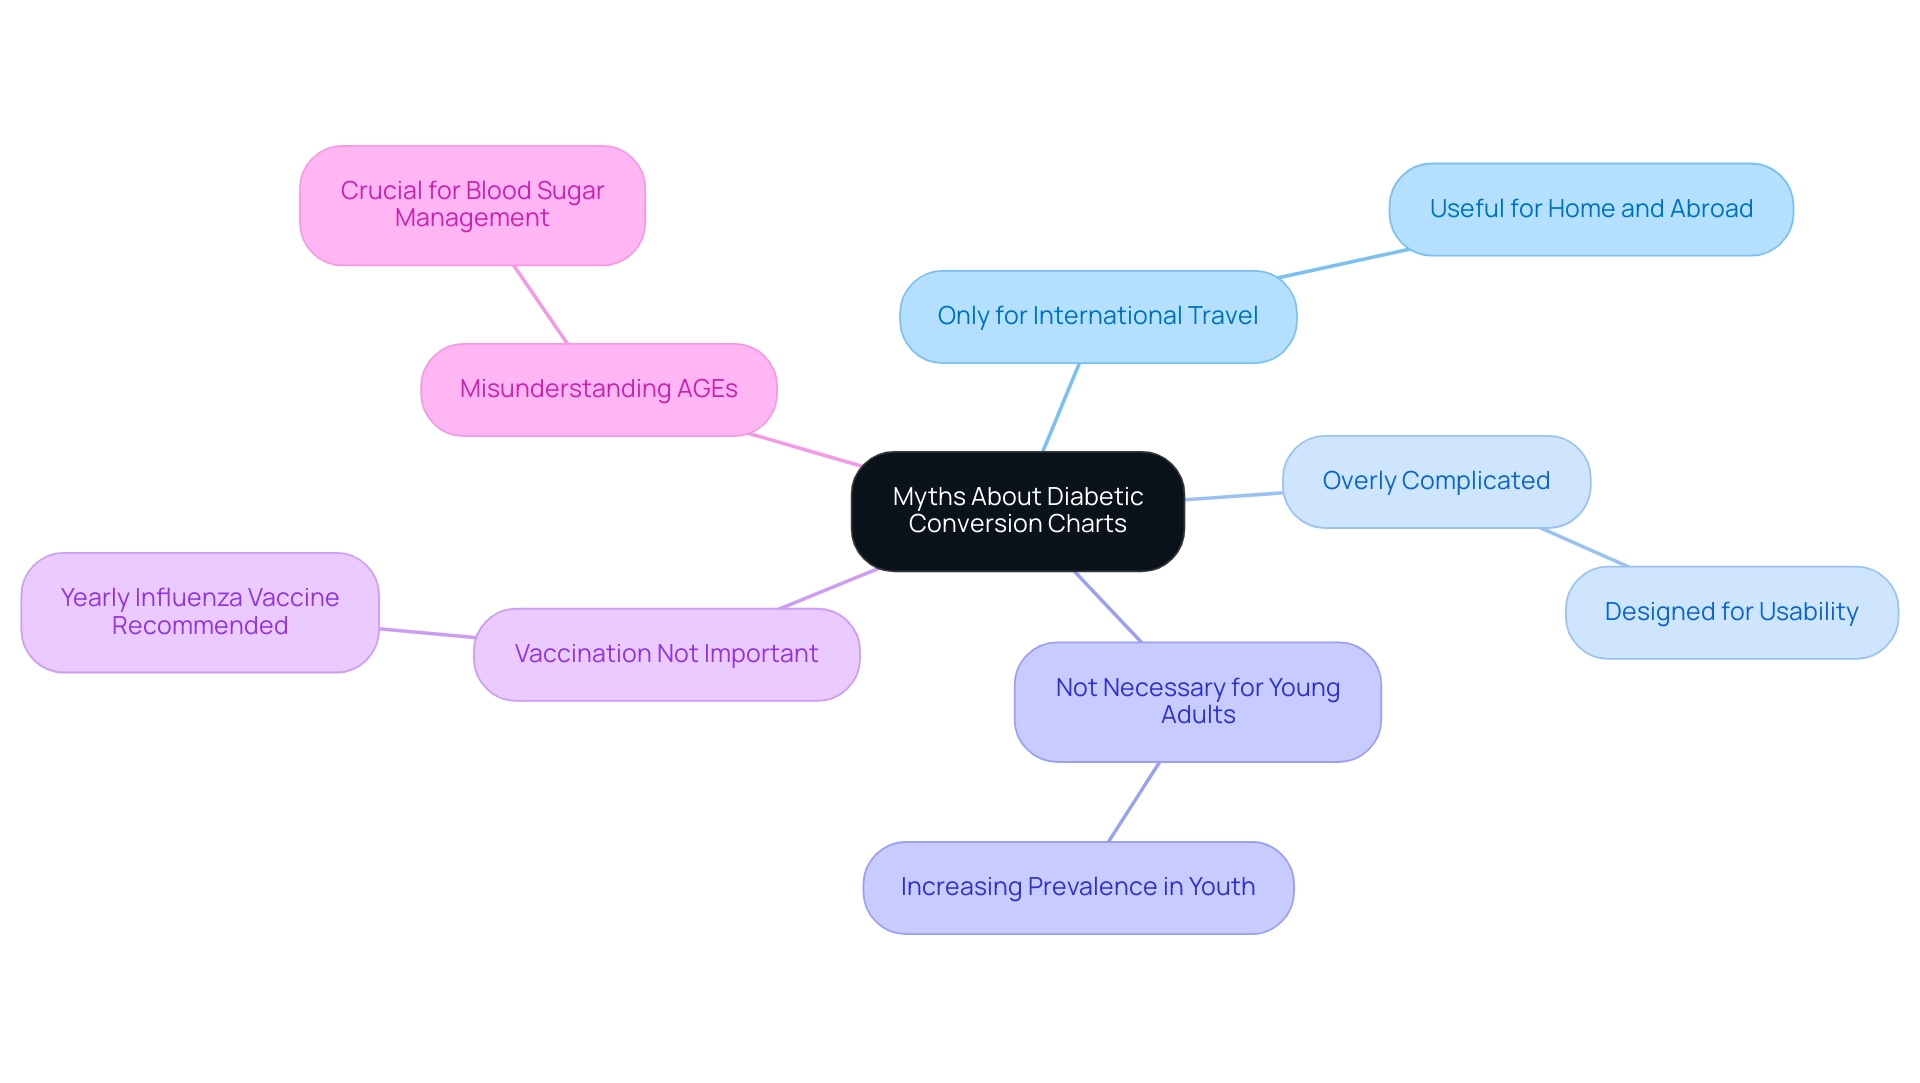
Misconceptions surrounding the diabetic conversion chart can create significant uncertainty for those managing their blood sugar. It's understandable to feel confused, especially when many believe these diagrams are only necessary for international travel. In truth, a diabetic conversion chart is invaluable for anyone dealing with blood sugar issues. It facilitates accurate interpretation of glucose readings across different measurement systems, whether at home or abroad.
Another common myth is that these translation tables are overly complicated and difficult to use. However, most charts are designed with usability in mind, featuring clear structures that simplify the transformation process. This accessibility is crucial, particularly as Type 2 diabetes is increasingly diagnosed in younger populations, underscoring the need for effective management tools.
The reality is that Type 2 diabetes is swiftly becoming more prevalent among teenagers and young adults. It’s essential for them to understand and utilize these resources effectively.
At T2DSolutions, we recognize the importance of addressing these misunderstandings to empower individuals in their health journey. For example, a case study focusing on preventive health measures for diabetic students illustrates the need for clear communication regarding health management tools. This study emphasizes the recommendation for diabetic students to receive a yearly influenza vaccine, a vital preventive measure that can enhance overall health management.
By confronting these misconceptions, T2DSolutions aims to help patients use the diabetic conversion chart effectively, ultimately improving their condition management and health outcomes. As noted by Brownlee et al., understanding the effects of advanced glycation end-products (AGEs) is crucial for effective blood sugar management, highlighting the necessity for reliable tools like conversion tables. Remember, you’re not alone in this journey; we are here to support you every step of the way.
Practical Tips for Integrating Diabetic Conversion Charts into Daily Management
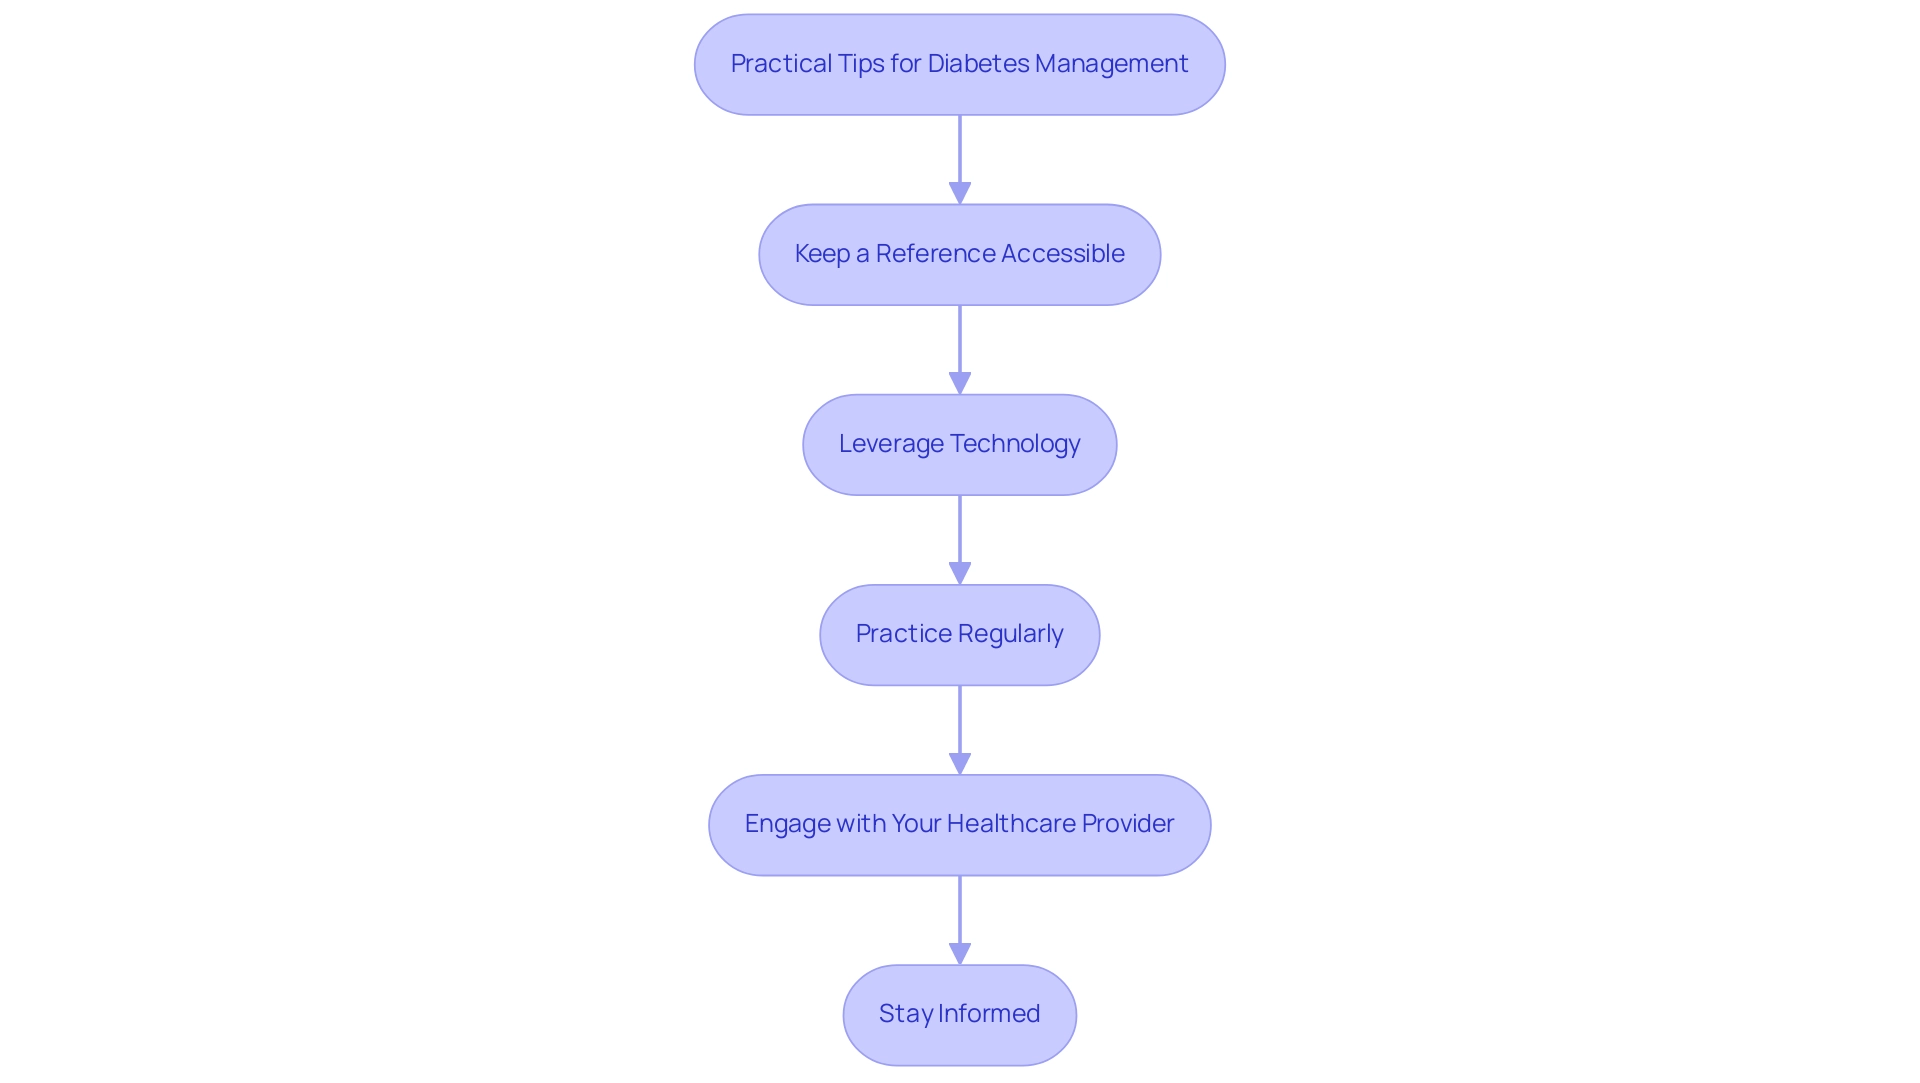
Incorporating a diabetic conversion chart into your daily management can significantly enhance your blood sugar care. At T2DSolutions, we are dedicated to providing newly diagnosed patients with the resources they need for effective management of their condition. Here are some practical tips to help you make the most of these valuable tools:
-
Keep a Reference Accessible: Print out a measurement guide and keep it with your glucose meter or in your diabetes management journal for easy access. This ensures you can quickly reference it when needed, reinforcing your understanding of blood sugar levels. T2DSolutions offers downloadable charts, such as a diabetic conversion chart, to assist you in this process.
-
Leverage Technology: Utilize mobile applications that include transformation tools, enabling you to perform quick changes on the go. T2DSolutions suggests particular applications that incorporate transformation features, simplifying your health management effectively.
-
Practice Regularly: Acquaint yourself with the diagram by practicing transformations with your daily readings. Consistent practice not only strengthens your comprehension but also fosters confidence in managing your condition effectively. T2DSolutions provides practice scenarios to help you gain proficiency.
-
Engage with Your Healthcare Provider: Bring your diabetic conversion chart to appointments and discuss how it can be used to interpret your readings effectively. This collaboration can enhance your understanding and management of blood sugar levels, ensuring that you are making informed decisions based on accurate data. As Dhatariya K. noted, "The systems may not also be able to cope with the acute changes that occur in the hospital," highlighting the importance of accurate data interpretation in managing blood sugar levels.
-
Stay Informed: Keep up with the latest news and research regarding blood sugar management. For instance, a recent study highlighted the effectiveness of remote programs that utilize continuous glucose monitoring (CGM) to provide lifestyle recommendations, demonstrating the potential of technology in improving health outcomes. This program enrolled 2,217 participants and resulted in significant improvements in hyperglycemia and glucose variability, showcasing how integrating technology can enhance management of the condition. T2DSolutions regularly updates its resources to reflect the latest research and findings.
It's also important to recognize that 80.6% of U.S. adults with a diabetes diagnosis had a systolic blood pressure of 130 mmHg or higher or were on medication for high blood pressure, underscoring the need for effective management strategies. Furthermore, the incidence of type 1 diabetes among children and adolescents has significantly increased, particularly among non-Hispanic Asian or Pacific Islander groups, emphasizing the growing relevance of education and management regarding this illness.
By incorporating these strategies and utilizing the resources available at T2DSolutions, you're not alone in this journey. Together, we can enhance your diabetes management and empower you to make informed decisions that contribute to better health outcomes.
Conclusion
Diabetic conversion charts are truly invaluable tools that significantly enhance diabetes management. They offer a standardized way to interpret blood glucose readings, helping patients understand their health metrics, no matter the measurement system in use. By enabling accurate glucose level interpretation, these charts empower individuals to take an active role in their health management, fostering better communication with healthcare providers and leading to improved health outcomes.
This article highlights the various types of conversion charts, including those for blood glucose and A1C levels, which are essential for understanding and managing diabetes. Mastering these tools not only aids in daily decision-making but also builds patient confidence, allowing for proactive health management. Furthermore, incorporating technology and educational resources can further enhance the effectiveness of these charts, ensuring patients are equipped with the knowledge necessary to navigate their diabetes journey successfully.
As diabetes care continues to evolve, the importance of diabetic conversion charts cannot be overstated. They serve as a bridge connecting patients and providers, simplifying complex data and facilitating informed treatment decisions. By utilizing these resources, individuals can take control of their health, leading to improved adherence to treatment plans and better overall health outcomes. Embracing these tools is a vital step toward effective diabetes management and a healthier future. Remember, you're not alone in this journey; we are here to support you every step of the way.
Frequently Asked Questions
What is a diabetic conversion chart?
A diabetic conversion chart is a vital resource that helps individuals understand their blood glucose measurements by translating values between milligrams per deciliter (mg/dL) and millimoles per liter (mmol/L). It is essential for those managing diabetes to communicate effectively with healthcare professionals about their glucose levels and treatment plans.
Why are diabetic conversion charts important?
Diabetic conversion charts improve accuracy in blood glucose monitoring, leading to more informed treatment decisions. They are particularly crucial in healthcare settings, such as intensive care environments, where maintaining glucose levels below 180 mg/dL is recommended to minimize complications.
How prevalent is the use of diabetic conversion charts among individuals with elevated blood sugar?
Approximately 70% of individuals facing blood sugar challenges rely on diabetic conversion charts for accurate measurements, which is vital for effective self-care and meaningful interactions with medical professionals.
How do diabetic conversion charts contribute to self-management of diabetes?
These charts provide clear guidance on interpreting glucose readings, fostering confidence and independence in individuals managing their condition. They empower users to make informed health choices.
What advancements in blood sugar management highlight the need for diabetic conversion charts?
Advancements such as sodium-glucose cotransporter 2 inhibitors (SGLT2i) and glucagon-like peptide 1 receptor agonists (GLP-1 RA) underscore the necessity for precise glucose management, especially for high-risk individuals with type 2 diabetes.
How do diabetic conversion charts enhance communication between patients and healthcare providers?
They provide a standardized way to interpret glucose readings, improving interactions and ensuring alignment on treatment goals and necessary adjustments. This clarity enhances treatment adherence and health outcomes.
What types of diabetic transformation tables exist?
The main types include diabetic conversion charts, which convert glucose levels between mg/dL and mmol/L, and medication conversion tables, which assist healthcare professionals in adjusting dosages of blood sugar medications based on individual needs.
What role does T2DSolutions play in diabetes management?
T2DSolutions is committed to providing essential resources, including diabetic conversion charts, to support individuals newly diagnosed with diabetes in navigating their management journey effectively.
